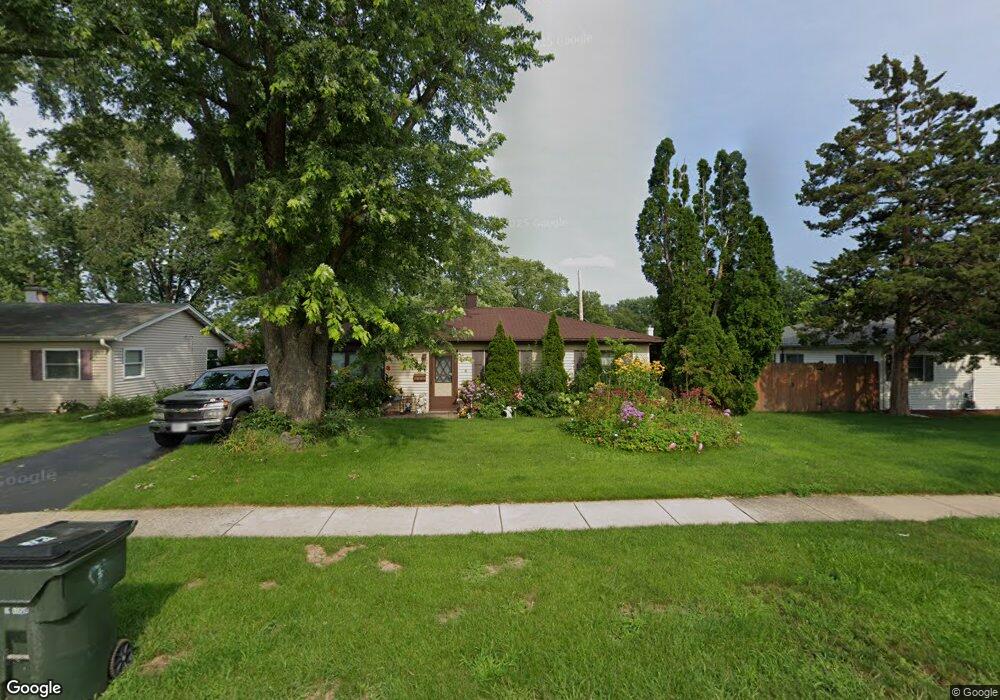
213 N California Ave Mundelein, IL 60060
Estimated Value: $296,000 - $346,000
4
Beds
2
Baths
1,528
Sq Ft
$210/Sq Ft
Est. Value
About This Home
This home is located at 213 N California Ave, Mundelein, IL 60060 and is currently estimated at $320,372, approximately $209 per square foot. 213 N California Ave is a home located in Lake County with nearby schools including Washington Early Learning Center, Mechanics Grove Elementary School, and Carl Sandburg Middle School.
Ownership History
Date
Name
Owned For
Owner Type
Purchase Details
Closed on
Nov 19, 2012
Sold by
Marcos Adelfo and Marcos Julia
Bought by
Cordova Humberto
Current Estimated Value
Home Financials for this Owner
Home Financials are based on the most recent Mortgage that was taken out on this home.
Original Mortgage
$105,311
Outstanding Balance
$72,288
Interest Rate
3.25%
Mortgage Type
FHA
Estimated Equity
$248,084
Purchase Details
Closed on
Aug 10, 2004
Sold by
Treend Ronald E and Treend Marcia A
Bought by
Marcos Adelfo
Home Financials for this Owner
Home Financials are based on the most recent Mortgage that was taken out on this home.
Original Mortgage
$209,950
Interest Rate
6.1%
Mortgage Type
Purchase Money Mortgage
Create a Home Valuation Report for This Property
The Home Valuation Report is an in-depth analysis detailing your home's value as well as a comparison with similar homes in the area
Home Values in the Area
Average Home Value in this Area
Purchase History
| Date | Buyer | Sale Price | Title Company |
|---|---|---|---|
| Cordova Humberto | $115,000 | Fidelity National Title | |
| Marcos Adelfo | $221,000 | -- |
Source: Public Records
Mortgage History
| Date | Status | Borrower | Loan Amount |
|---|---|---|---|
| Open | Cordova Humberto | $105,311 | |
| Previous Owner | Marcos Adelfo | $209,950 |
Source: Public Records
Tax History Compared to Growth
Tax History
| Year | Tax Paid | Tax Assessment Tax Assessment Total Assessment is a certain percentage of the fair market value that is determined by local assessors to be the total taxable value of land and additions on the property. | Land | Improvement |
|---|---|---|---|---|
| 2024 | $7,900 | $89,922 | $16,358 | $73,564 |
| 2023 | $7,403 | $82,391 | $14,988 | $67,403 |
| 2022 | $7,403 | $74,815 | $14,155 | $60,660 |
| 2021 | $7,076 | $72,194 | $13,659 | $58,535 |
| 2020 | $6,956 | $70,207 | $13,283 | $56,924 |
| 2019 | $6,730 | $67,898 | $12,846 | $55,052 |
| 2018 | $5,646 | $57,934 | $12,272 | $45,662 |
| 2017 | $5,571 | $56,111 | $11,886 | $44,225 |
| 2016 | $5,414 | $53,292 | $11,289 | $42,003 |
| 2015 | $5,263 | $49,960 | $10,583 | $39,377 |
| 2014 | $5,053 | $48,959 | $10,489 | $38,470 |
| 2012 | $5,201 | $49,394 | $10,582 | $38,812 |
Source: Public Records
Map
Nearby Homes
- 207 N Idlewild Ave
- 250 N Fairlawn Ave
- 26220 N Midlothian Rd
- 547 N Ridgemoor Ave
- 116 S Pershing Ave
- 1297 Spalding Dr
- 1305 Spalding Dr
- 619 N California Ave Unit 1
- 29746 U S 45
- 851 Glenview Ave
- 201 Bingham Cir
- 208 Bingham Cir
- 728 W Maple Ave
- 1360 Edington Ln
- 331 Plaza Cir
- 123 Dunton Ct
- 742 N Lake St
- 26980 N Pierre Dr
- 973 Highland Rd
- 19925 W Il Route 60
- 221 N California Ave
- 203 N California Ave
- 618 W Division St
- 229 N California Ave
- 610 W Division St
- 235 N California Ave
- 222 N Pershing Ave
- 214 N California Ave
- 214 N Pershing Ave
- 169 N California Ave
- 208 N California Ave
- 230 N Pershing Ave
- 204 N Pershing Ave
- 232 N California Ave
- 241 N California Ave
- 236 N Pershing Ave
- 170 N Pershing Ave
- 238 N California Ave
- 170 N California Ave