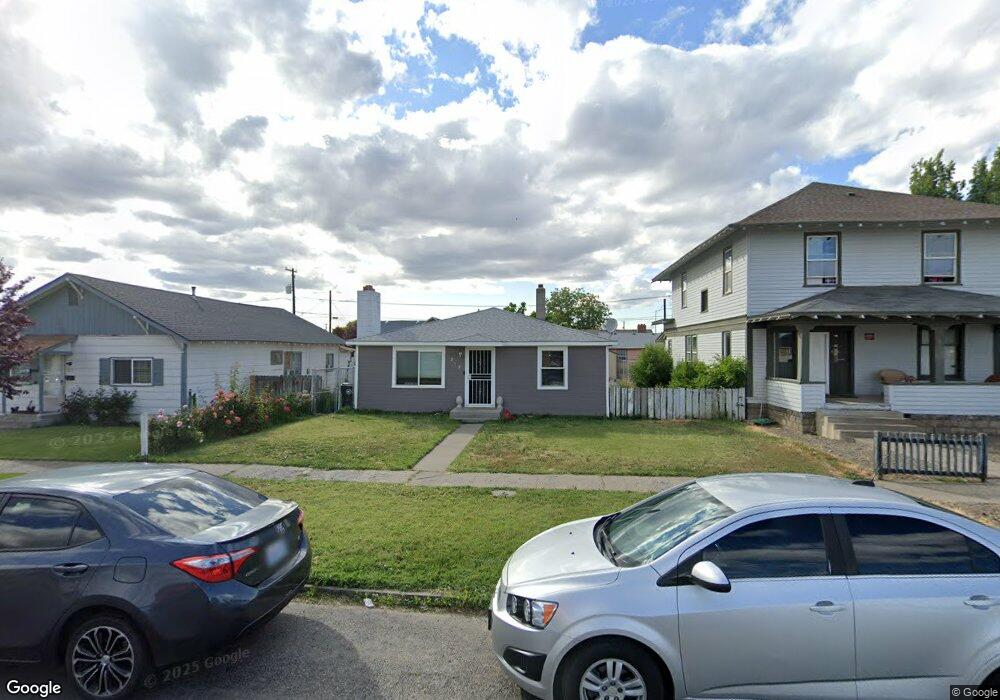
213 N Chestnut St Toppenish, WA 98948
Estimated Value: $254,000 - $279,000
3
Beds
1
Bath
1,320
Sq Ft
$205/Sq Ft
Est. Value
About This Home
This home is located at 213 N Chestnut St, Toppenish, WA 98948 and is currently estimated at $270,068, approximately $204 per square foot. 213 N Chestnut St is a home located in Yakima County with nearby schools including Toppenish High School.
Ownership History
Date
Name
Owned For
Owner Type
Purchase Details
Closed on
Jan 18, 2005
Sold by
Carillo Karina
Bought by
Carrillo Noe
Current Estimated Value
Home Financials for this Owner
Home Financials are based on the most recent Mortgage that was taken out on this home.
Original Mortgage
$78,700
Outstanding Balance
$47,277
Interest Rate
8.75%
Mortgage Type
New Conventional
Estimated Equity
$222,791
Purchase Details
Closed on
Dec 30, 2002
Sold by
Bank Of America Na
Bought by
Carrillo Noe
Home Financials for this Owner
Home Financials are based on the most recent Mortgage that was taken out on this home.
Original Mortgage
$71,300
Interest Rate
5.89%
Purchase Details
Closed on
Mar 2, 2001
Sold by
Mendoza Antonio and Mendoza Carmen
Bought by
Bank Of America Na
Purchase Details
Closed on
May 4, 1999
Sold by
Macomber Leon A and Estate Of Leon H Macomber
Bought by
Mendoza Antonio and Mendoza Carmen
Home Financials for this Owner
Home Financials are based on the most recent Mortgage that was taken out on this home.
Original Mortgage
$72,750
Interest Rate
6.96%
Create a Home Valuation Report for This Property
The Home Valuation Report is an in-depth analysis detailing your home's value as well as a comparison with similar homes in the area
Home Values in the Area
Average Home Value in this Area
Purchase History
| Date | Buyer | Sale Price | Title Company |
|---|---|---|---|
| Carrillo Noe | -- | Pacific Alliance Title Co | |
| Carrillo Noe | $72,000 | Fidelity Title Company | |
| Bank Of America Na | $77,000 | Valley Title Company | |
| Mendoza Antonio | $75,000 | Schreiner Title Company |
Source: Public Records
Mortgage History
| Date | Status | Borrower | Loan Amount |
|---|---|---|---|
| Open | Carrillo Noe | $78,700 | |
| Previous Owner | Carrillo Noe | $71,300 | |
| Previous Owner | Mendoza Antonio | $72,750 |
Source: Public Records
Tax History Compared to Growth
Tax History
| Year | Tax Paid | Tax Assessment Tax Assessment Total Assessment is a certain percentage of the fair market value that is determined by local assessors to be the total taxable value of land and additions on the property. | Land | Improvement |
|---|---|---|---|---|
| 2025 | $1,831 | $213,800 | $33,900 | $179,900 |
| 2023 | $2,051 | $168,900 | $33,700 | $135,200 |
| 2022 | $1,635 | $145,100 | $34,100 | $111,000 |
| 2021 | $1,833 | $131,100 | $30,700 | $100,400 |
| 2019 | $1,306 | $111,900 | $27,300 | $84,600 |
| 2018 | $1,145 | $97,500 | $26,200 | $71,300 |
| 2017 | $1,018 | $97,300 | $26,200 | $71,100 |
| 2016 | $980 | $96,750 | $26,150 | $70,600 |
| 2015 | $980 | $91,850 | $26,150 | $65,700 |
| 2014 | $980 | $91,850 | $26,150 | $65,700 |
| 2013 | $980 | $91,850 | $26,150 | $65,700 |
Source: Public Records
Map
Nearby Homes
- 103 N Date St
- 412 Maple Ct
- 10 S Date St
- 3 S Elm St
- 108 S Fir St
- 309 & 309 W 2nd Ave
- 914 Madison Ave
- 516 W 3rd Ave
- 603 S Toppenish Ave
- 542 Lillie Ln
- 97 E McDonald Rd
- 300 Fort Rd
- 151 W Elmwood Ln
- 1007 Vintage Valley Pkwy
- 270 Cheyne Rd
- 11 3rd Ave
- 314 2nd Ave
- NKA Buena Rd
- 506 & 508 2nd Ave
- 8019 Vialago Pkwy
- 215 N Chestnut St
- 211 N Chestnut St
- 209 N Chestnut St
- 207 Dayton Ave
- 212 N Date St
- 207 N Chestnut St
- 301 N Chestnut St
- 210 N Date St
- 211 Dayton Ave
- 212 N Chestnut St
- 205 N Chestnut St
- 208 N Date St
- 210 N Chestnut St
- 210 Dayton Ave
- 208 N Chestnut St
- 206 N Date St
- 302 N Date St
- 305 N Chestnut St
- 304 N Chestnut St
- 201 N Chestnut St