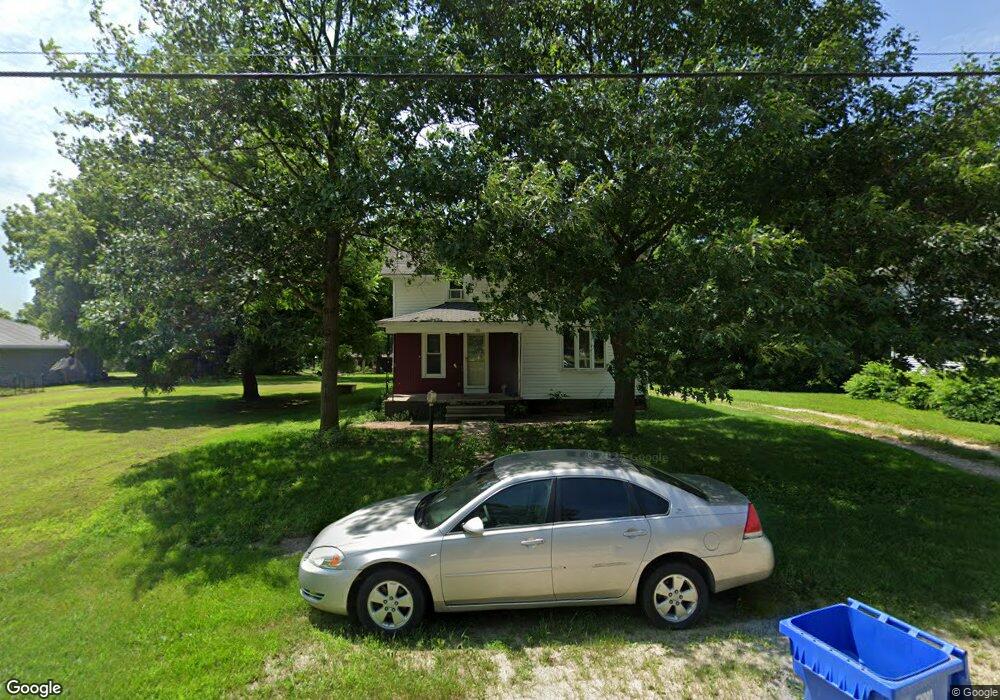
213 N Main St Marble Rock, IA 50653
Estimated Value: $76,393 - $117,000
4
Beds
1
Bath
1,428
Sq Ft
$68/Sq Ft
Est. Value
About This Home
This home is located at 213 N Main St, Marble Rock, IA 50653 and is currently estimated at $96,598, approximately $67 per square foot. 213 N Main St is a home located in Floyd County with nearby schools including Rudd-Rockford-Marble Rock Elementary School and Rockford Junior/Senior High School.
Ownership History
Date
Name
Owned For
Owner Type
Purchase Details
Closed on
Mar 12, 2005
Sold by
Ott Michael R and Ott Terry Ann
Bought by
Parcher Kenneth E
Current Estimated Value
Home Financials for this Owner
Home Financials are based on the most recent Mortgage that was taken out on this home.
Original Mortgage
$17,000
Outstanding Balance
$8,595
Interest Rate
5.67%
Mortgage Type
Future Advance Clause Open End Mortgage
Estimated Equity
$88,003
Create a Home Valuation Report for This Property
The Home Valuation Report is an in-depth analysis detailing your home's value as well as a comparison with similar homes in the area
Home Values in the Area
Average Home Value in this Area
Purchase History
| Date | Buyer | Sale Price | Title Company |
|---|---|---|---|
| Parcher Kenneth E | $20,000 | None Available |
Source: Public Records
Mortgage History
| Date | Status | Borrower | Loan Amount |
|---|---|---|---|
| Open | Parcher Kenneth E | $17,000 |
Source: Public Records
Tax History Compared to Growth
Tax History
| Year | Tax Paid | Tax Assessment Tax Assessment Total Assessment is a certain percentage of the fair market value that is determined by local assessors to be the total taxable value of land and additions on the property. | Land | Improvement |
|---|---|---|---|---|
| 2025 | $942 | $56,200 | $3,800 | $52,400 |
| 2024 | $942 | $57,050 | $3,800 | $53,250 |
| 2023 | $772 | $57,050 | $3,800 | $53,250 |
| 2022 | $792 | $42,000 | $3,800 | $38,200 |
| 2021 | $532 | $42,000 | $3,800 | $38,200 |
| 2020 | $532 | $35,630 | $3,800 | $31,830 |
| 2019 | $690 | $42,330 | $3,800 | $38,530 |
| 2018 | $624 | $43,770 | $3,800 | $39,970 |
| 2017 | $586 | $43,770 | $3,800 | $39,970 |
| 2016 | $606 | $43,770 | $3,800 | $39,970 |
| 2015 | $606 | $41,210 | $3,800 | $37,410 |
| 2014 | $618 | $41,210 | $3,800 | $37,410 |
Source: Public Records
Map
Nearby Homes