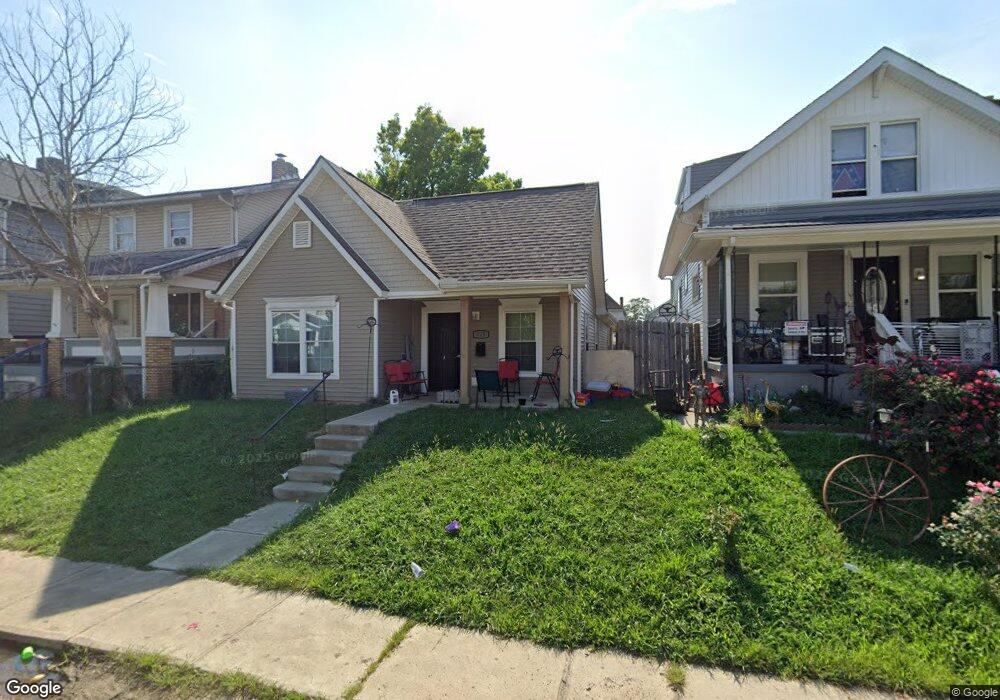
213 N Oakley Ave Columbus, OH 43204
North Hilltop NeighborhoodEstimated Value: $186,000 - $212,000
2
Beds
1
Bath
1,168
Sq Ft
$171/Sq Ft
Est. Value
About This Home
This home is located at 213 N Oakley Ave, Columbus, OH 43204 and is currently estimated at $199,667, approximately $170 per square foot. 213 N Oakley Ave is a home with nearby schools including West Broad Elementary School, Westmoor Middle School, and West High School.
Ownership History
Date
Name
Owned For
Owner Type
Purchase Details
Closed on
Jul 17, 2019
Sold by
Central Ohio Community Improvement Corp
Bought by
Hilltop City Cottages Llc
Current Estimated Value
Purchase Details
Closed on
Aug 29, 2016
Sold by
City Of Columbus
Bought by
Central Ohio Community Improvement Corpo
Purchase Details
Closed on
Aug 25, 2016
Sold by
City Of Columbus
Bought by
Central Ohio Community Improvement Corpo
Purchase Details
Closed on
Mar 25, 2008
Sold by
Hud
Bought by
City Of Columbus
Purchase Details
Closed on
Oct 13, 2006
Sold by
Billingsley Glen E
Bought by
Hud
Purchase Details
Closed on
Mar 27, 1986
Bought by
Billingsley Glen E
Create a Home Valuation Report for This Property
The Home Valuation Report is an in-depth analysis detailing your home's value as well as a comparison with similar homes in the area
Home Values in the Area
Average Home Value in this Area
Purchase History
| Date | Buyer | Sale Price | Title Company |
|---|---|---|---|
| Hilltop City Cottages Llc | -- | None Available | |
| Central Ohio Community Improvement Corpo | -- | None Available | |
| Central Ohio Community Improvement Corpo | -- | None Available | |
| City Of Columbus | -- | Lakeside Ti | |
| Hud | $22,205 | None Available | |
| Billingsley Glen E | $30,000 | -- |
Source: Public Records
Tax History Compared to Growth
Tax History
| Year | Tax Paid | Tax Assessment Tax Assessment Total Assessment is a certain percentage of the fair market value that is determined by local assessors to be the total taxable value of land and additions on the property. | Land | Improvement |
|---|---|---|---|---|
| 2024 | $2,539 | $55,410 | $4,270 | $51,140 |
| 2023 | $2,508 | $55,405 | $4,270 | $51,135 |
| 2022 | $2,515 | $47,330 | $1,370 | $45,960 |
| 2021 | $2,520 | $47,330 | $1,370 | $45,960 |
| 2020 | $950 | $17,820 | $1,370 | $16,450 |
| 2019 | $0 | $1,160 | $1,160 | $0 |
| 2018 | $0 | $8,750 | $5,040 | $3,710 |
| 2017 | $0 | $8,750 | $5,040 | $3,710 |
| 2016 | $0 | $8,750 | $5,040 | $3,710 |
| 2015 | -- | $8,750 | $5,040 | $3,710 |
| 2014 | -- | $8,750 | $5,040 | $3,710 |
| 2013 | -- | $8,750 | $5,040 | $3,710 |
Source: Public Records
Map
Nearby Homes
- 210 N Oakley Ave
- 188 N Eureka Ave
- 274 N Wayne Ave
- 146 N Wayne Ave
- 285 N Wayne Ave
- 149 N Eureka Ave
- 120 N Eureka Ave Unit 122
- 117-119 N Wheatland Ave
- 2360 Westwood Dr
- 67 N Wheatland Ave
- 27 S Oakley Ave
- 75 N Terrace Ave
- 298 N Burgess Ave
- 78 N Burgess Ave
- 127 N Burgess Ave
- 118 N Ogden Ave
- 57 S Eureka Ave
- 66 S Wheatland Ave
- 95 S Eureka Ave
- 87 N Warren Ave
- 217 N Oakley Ave
- 209 N Oakley Ave
- 223 N Oakley Ave
- 227 N Oakley Ave
- 199 N Oakley Ave
- 233 N Oakley Ave
- 216 N Oakley Ave
- 220 N Oakley Ave
- 195 N Oakley Ave
- 206 N Oakley Ave
- 212 N Wayne Ave
- 206 N Wayne Ave
- 216 N Wayne Ave
- 202 N Wayne Ave
- 220 N Wayne Ave
- 228 N Oakley Ave
- 202 N Oakley Ave
- 191 N Oakley Ave
- 210 N Wayne Ave
- 198 N Wayne Ave