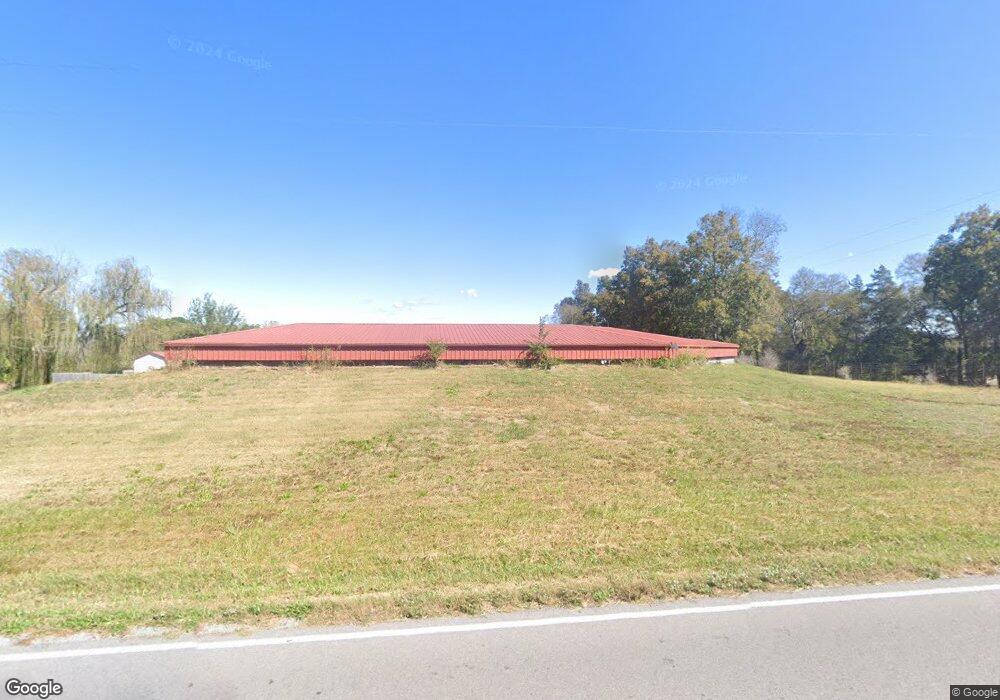
213 New Center Church Rd Shelbyville, TN 37160
Estimated Value: $588,000 - $704,000
--
Bed
2
Baths
4,564
Sq Ft
$144/Sq Ft
Est. Value
About This Home
This home is located at 213 New Center Church Rd, Shelbyville, TN 37160 and is currently estimated at $655,333, approximately $143 per square foot. 213 New Center Church Rd is a home located in Bedford County with nearby schools including Liberty Elementary School.
Ownership History
Date
Name
Owned For
Owner Type
Purchase Details
Closed on
Oct 30, 2020
Sold by
Ficorilli Michael E and Ficorilli Michael E
Bought by
Ficorilli Michael E
Current Estimated Value
Purchase Details
Closed on
Mar 3, 2014
Sold by
Ficorilli Jeanmarie
Bought by
Ficorilli Michael E
Purchase Details
Closed on
Jul 8, 2013
Sold by
Ficorilli Michael E
Bought by
Philpott Stephen Lee and Philpott Elaine Sue
Purchase Details
Closed on
May 12, 2004
Sold by
Madeiros John William
Bought by
Ficorilli Michael E
Purchase Details
Closed on
Mar 12, 2004
Sold by
William Madeiros J
Bought by
Ficorilli Michael E
Purchase Details
Closed on
Jul 26, 1994
Bought by
Mary Madeiros J and Mary Ann
Purchase Details
Closed on
Apr 15, 1992
Bought by
Grissom Randall L
Purchase Details
Closed on
Mar 31, 1981
Bought by
Bobo Phillip D and Bobo Cathy T
Create a Home Valuation Report for This Property
The Home Valuation Report is an in-depth analysis detailing your home's value as well as a comparison with similar homes in the area
Home Values in the Area
Average Home Value in this Area
Purchase History
| Date | Buyer | Sale Price | Title Company |
|---|---|---|---|
| Ficorilli Michael E | -- | None Available | |
| Ficorilli Michael E | -- | -- | |
| Philpott Stephen Lee | $50,000 | -- | |
| Ficorilli Michael E | $60,000 | -- | |
| Ficorilli Michael E | $240,000 | -- | |
| Mary Madeiros J | $130,000 | -- | |
| Grissom Randall L | $130,000 | -- | |
| Bobo Phillip D | -- | -- |
Source: Public Records
Tax History Compared to Growth
Tax History
| Year | Tax Paid | Tax Assessment Tax Assessment Total Assessment is a certain percentage of the fair market value that is determined by local assessors to be the total taxable value of land and additions on the property. | Land | Improvement |
|---|---|---|---|---|
| 2025 | $2,131 | $91,650 | $0 | $0 |
| 2024 | $2,131 | $91,650 | $19,500 | $72,150 |
| 2023 | $2,131 | $91,650 | $19,500 | $72,150 |
| 2022 | $2,131 | $91,650 | $19,500 | $72,150 |
| 2021 | $1,801 | $91,650 | $19,500 | $72,150 |
| 2020 | $1,488 | $91,650 | $19,500 | $72,150 |
| 2019 | $1,488 | $55,925 | $14,500 | $41,425 |
| 2018 | $1,432 | $55,925 | $14,500 | $41,425 |
| 2017 | $1,432 | $55,925 | $14,500 | $41,425 |
| 2016 | $1,409 | $55,925 | $14,500 | $41,425 |
| 2015 | $1,409 | $55,925 | $14,500 | $41,425 |
| 2014 | $1,309 | $57,656 | $0 | $0 |
Source: Public Records
Map
Nearby Homes
- 506 New Center Church Rd
- 0 New Center Church Rd
- 485 Naron Rd
- 349 Naron Rd
- 112 August Way
- 116 Stonebrook Dr
- 107 Stonebrook Dr
- 0 Hilltop Dr
- 102 Doak St
- 315 Woodland Dr
- 1261 Highway 130 W
- 823 Brookhaven Cir
- 127 Doak St
- 495 Himesville Rd
- 302 Graydon St
- 1106 Highway 130 W
- 602 Narrows Rd
- 310 Crest Dr
- 455 Himesville Rd
- 7 Dixon Rd
- 222 New Center Church Rd
- 204 New Center Church Rd
- 930 Old Center Church Rd
- 0 Old Center Church Rd
- 1005 New Center Church Rd
- 1005 Old Center Church Rd
- 310 New Center Church Rd
- 132 New Center Church Rd
- 1 Snell Rd
- 348 New Center Church Rd
- 385 New Center Church Rd
- 352 New Center Church Rd
- 1009 Old Center Church Rd
- 899 Old Center Church Rd
- 2425 Highway 231 S
- 2429 Highway 231 S
- 1013 Old Center Church Rd
- 2433 Highway 231 S
- 2433 Hwy 231 S