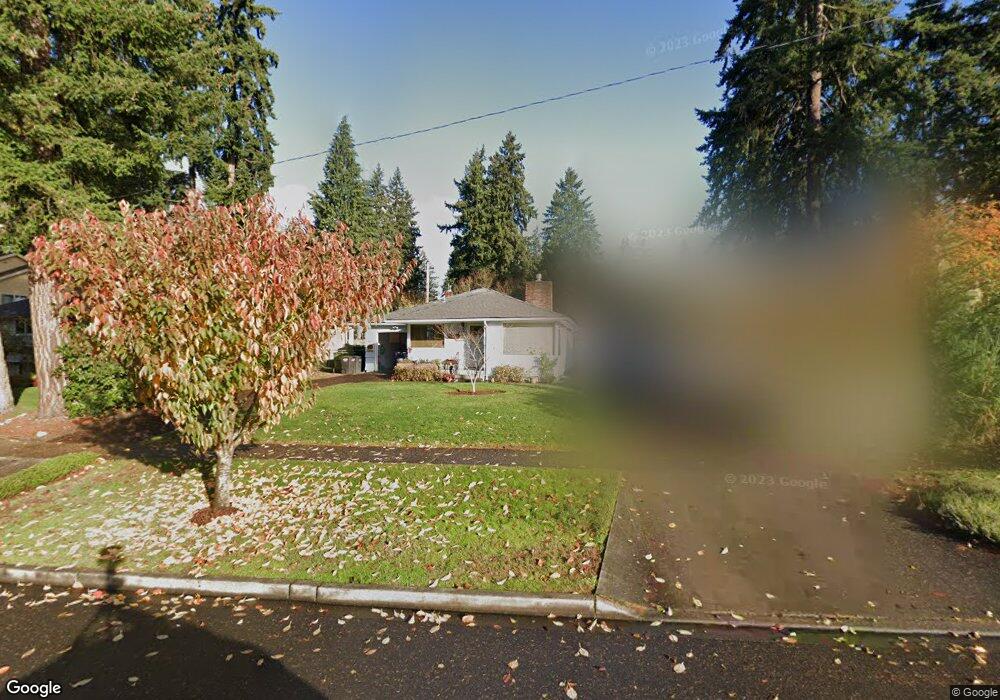
213 Regents Blvd Fircrest, WA 98466
Estimated Value: $483,493 - $544,000
3
Beds
2
Baths
1,346
Sq Ft
$382/Sq Ft
Est. Value
About This Home
This home is located at 213 Regents Blvd, Fircrest, WA 98466 and is currently estimated at $514,123, approximately $381 per square foot. 213 Regents Blvd is a home located in Pierce County with nearby schools including Whittier Elementary School, Wainwright Intermediate School, and Foss High School.
Ownership History
Date
Name
Owned For
Owner Type
Purchase Details
Closed on
Oct 21, 2004
Sold by
Scott Matthew W
Bought by
Anderson Gary W and Anderson Catherine J
Current Estimated Value
Home Financials for this Owner
Home Financials are based on the most recent Mortgage that was taken out on this home.
Original Mortgage
$55,000
Outstanding Balance
$27,184
Interest Rate
5.74%
Mortgage Type
Purchase Money Mortgage
Estimated Equity
$486,939
Purchase Details
Closed on
Jun 8, 2001
Sold by
Campbell John B
Bought by
Scott Matthew W and Scott Jenine R
Home Financials for this Owner
Home Financials are based on the most recent Mortgage that was taken out on this home.
Original Mortgage
$121,365
Interest Rate
7.14%
Purchase Details
Closed on
Dec 19, 1997
Sold by
Srail David S
Bought by
Campbell John B
Home Financials for this Owner
Home Financials are based on the most recent Mortgage that was taken out on this home.
Original Mortgage
$92,750
Interest Rate
7.5%
Purchase Details
Closed on
Aug 10, 1994
Sold by
Liebenow Dianne Becker
Bought by
Liebenow William Michael
Create a Home Valuation Report for This Property
The Home Valuation Report is an in-depth analysis detailing your home's value as well as a comparison with similar homes in the area
Home Values in the Area
Average Home Value in this Area
Purchase History
| Date | Buyer | Sale Price | Title Company |
|---|---|---|---|
| Anderson Gary W | $206,000 | Fidelity National Title Co | |
| Scott Matthew W | $135,000 | -- | |
| Campbell John B | $134,896 | Commonwealth Title Company | |
| Campbell John B | -- | Commonwealth Title Company | |
| Liebenow William Michael | -- | -- | |
| Liebenow William Michael | -- | -- |
Source: Public Records
Mortgage History
| Date | Status | Borrower | Loan Amount |
|---|---|---|---|
| Open | Anderson Gary W | $55,000 | |
| Previous Owner | Scott Matthew W | $121,365 | |
| Previous Owner | Campbell John B | $92,750 |
Source: Public Records
Tax History Compared to Growth
Tax History
| Year | Tax Paid | Tax Assessment Tax Assessment Total Assessment is a certain percentage of the fair market value that is determined by local assessors to be the total taxable value of land and additions on the property. | Land | Improvement |
|---|---|---|---|---|
| 2025 | $653 | $465,500 | $271,500 | $194,000 |
| 2024 | $653 | $459,100 | $255,600 | $203,500 |
| 2023 | $653 | $448,600 | $251,600 | $197,000 |
| 2022 | $3,953 | $450,300 | $258,700 | $191,600 |
| 2021 | $3,736 | $321,400 | $173,300 | $148,100 |
| 2019 | $2,895 | $295,500 | $148,300 | $147,200 |
| 2018 | $3,171 | $268,600 | $127,600 | $141,000 |
| 2017 | $2,874 | $238,400 | $103,600 | $134,800 |
| 2016 | $2,655 | $188,000 | $75,300 | $112,700 |
| 2014 | $2,517 | $179,500 | $72,300 | $107,200 |
| 2013 | $2,517 | $160,600 | $65,000 | $95,600 |
Source: Public Records
Map
Nearby Homes
- 306 Stanford St
- 445 Buena Vista Ave
- 106 Holly Ct
- 214 Summit Ave
- 702 Yale St
- 1813 S Woodlawn St
- 2902 S Monroe St
- 1203 Contra Costa Ave
- 3506 S Tyler St
- 1605 S Highland Ave
- 2950 S Proctor St Unit 1
- 1310 Boise St Unit 2
- 6320 Gregory St W
- 1324 Boise St
- 1258 Huson Dr
- 3619 S Tyler St
- 1720 S Tyler St Unit Lot 1
- 1724 S Tyler St Unit Lot 2
- 1349 S Highland Ave
- 3636 S Tyler St
- 209 Regents Blvd
- 221 Regents Blvd
- 205 Regents Blvd
- 225 Regents Blvd
- 540 Farallone Ave
- 536 Farallone Ave
- 550 Harvard Ave
- 532 Farallone Ave
- 546 Farallone Ave
- 231 Regents Blvd
- 138 Regents Blvd
- 524 Farallone Ave
- 134 Regents Blvd
- 144 Regents Blvd
- 130 Regents Blvd
- 128 Regents Blvd
- 113 Regents Blvd
- 533 Farallone Ave
- 611 San Juan Ave
- 516 Farallone Ave