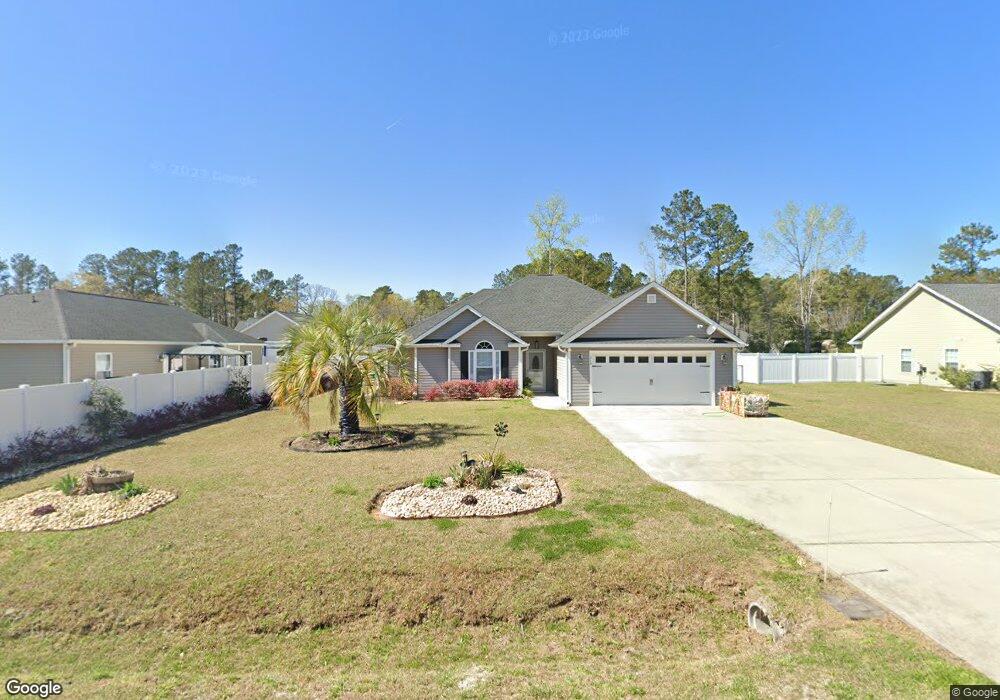
213 Royals Cir Conway, SC 29526
Estimated Value: $311,782 - $350,000
3
Beds
2
Baths
1,605
Sq Ft
$207/Sq Ft
Est. Value
About This Home
This home is located at 213 Royals Cir, Conway, SC 29526 and is currently estimated at $331,696, approximately $206 per square foot. 213 Royals Cir is a home located in Horry County with nearby schools including Daisy Elementary School, Loris Middle School, and Loris High School.
Ownership History
Date
Name
Owned For
Owner Type
Purchase Details
Closed on
Aug 31, 2017
Sold by
Lewis Construction Group L
Bought by
Hapeman Margaret
Current Estimated Value
Home Financials for this Owner
Home Financials are based on the most recent Mortgage that was taken out on this home.
Original Mortgage
$146,356
Outstanding Balance
$122,316
Interest Rate
3.93%
Mortgage Type
New Conventional
Estimated Equity
$209,380
Purchase Details
Closed on
Apr 26, 2016
Sold by
Todd Judy G
Bought by
Lewis Construction Group Llc
Home Financials for this Owner
Home Financials are based on the most recent Mortgage that was taken out on this home.
Original Mortgage
$500,000
Interest Rate
3.71%
Purchase Details
Closed on
Apr 25, 2016
Sold by
Todd Judy G
Bought by
Lewis Construction Group Llc
Home Financials for this Owner
Home Financials are based on the most recent Mortgage that was taken out on this home.
Original Mortgage
$500,000
Interest Rate
3.71%
Create a Home Valuation Report for This Property
The Home Valuation Report is an in-depth analysis detailing your home's value as well as a comparison with similar homes in the area
Home Values in the Area
Average Home Value in this Area
Purchase History
| Date | Buyer | Sale Price | Title Company |
|---|---|---|---|
| Hapeman Margaret | $182,945 | -- | |
| Lewis Construction Group Llc | $84,000 | -- | |
| Lewis Construction Group Llc | $84,000 | -- |
Source: Public Records
Mortgage History
| Date | Status | Borrower | Loan Amount |
|---|---|---|---|
| Open | Hapeman Margaret | $146,356 | |
| Previous Owner | Lewis Construction Group Llc | $500,000 | |
| Previous Owner | Lewis Construction Group Llc | $67,200 | |
| Previous Owner | Lewis Construction Group Llc | $500,000 |
Source: Public Records
Tax History Compared to Growth
Tax History
| Year | Tax Paid | Tax Assessment Tax Assessment Total Assessment is a certain percentage of the fair market value that is determined by local assessors to be the total taxable value of land and additions on the property. | Land | Improvement |
|---|---|---|---|---|
| 2024 | $926 | $10,654 | $1,307 | $9,347 |
| 2023 | $926 | $7,912 | $668 | $7,244 |
| 2021 | $838 | $7,912 | $668 | $7,244 |
| 2020 | $733 | $7,912 | $668 | $7,244 |
| 2019 | $733 | $7,912 | $668 | $7,244 |
| 2018 | $0 | $7,600 | $1,400 | $6,200 |
| 2017 | $155 | $468 | $468 | $0 |
| 2016 | $0 | $701 | $701 | $0 |
| 2015 | -- | $702 | $702 | $0 |
| 2014 | $150 | $702 | $702 | $0 |
Source: Public Records
Map
Nearby Homes
- 0 S Carolina 905
- Camden Plan at Ambridge
- Savannah Plan at Ambridge
- Windsor Plan at Ambridge
- Conway Plan at Ambridge
- Georgetown Plan at Ambridge
- TBD Highway 905
- TBD 3 Buckingham Dr
- TBD 4 Buckingham Dr
- TBD 1 Buckingham Dr
- TBD 5 Buckingham Dr
- TBD 2 Buckingham Dr
- 135 Buckingham Dr
- 104 Lure Ct
- 6939 Daphane Dr
- 534 War Eagle Ct
- 640 Carter Reid Ct
- 623 Carter Reid Ct
- 501 War Eagle Ct
- 608 Carter Reid Ct
- 213 Royals Cir Unit Lot 3 - Tupelo plan
- Lot 1 Royals Cir
- 219 Royals Cir Unit Oak II plan - Lot 2
- 207 Royals Cir
- 207 Royals Cir Unit Lot 4 - Holly plan
- 185 Royals Cir
- 185 Royals Cir Unit Lot 5 - Oak II
- 225 Royals Cir
- 225 Royals Cir Unit Lot 1
- TBD Royals Cir
- 173 Royals Cir
- 173 Royals Cir Unit Lot 7 - Holly plan
- 179 Royals Cir
- 179 Royals Cir Unit Lot 6
- 231 Royals Cir Unit Oak II plan - lot 9
- 231 Royals Cir
- 208 Royals Cir
- 176 Royals Cir
- 135 Royals Cir Unit 2107 Highway 90
- 186 Royals Cir