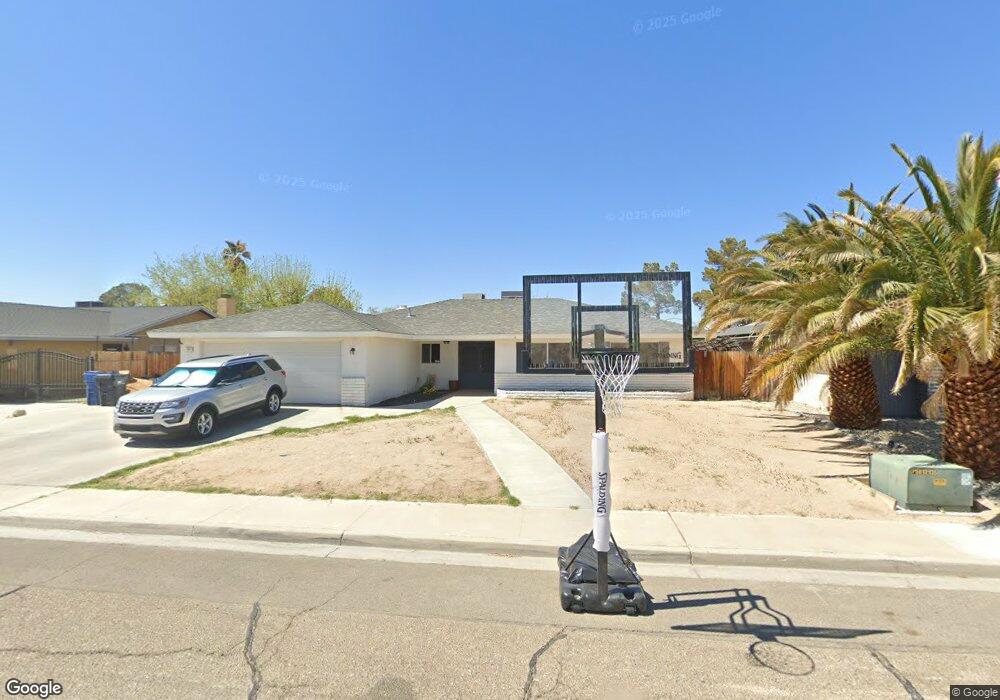
213 S Locust St Unit B Ridgecrest, CA 93555
Estimated Value: $169,000 - $253,000
3
Beds
2
Baths
1,475
Sq Ft
$152/Sq Ft
Est. Value
About This Home
This home is located at 213 S Locust St Unit B, Ridgecrest, CA 93555 and is currently estimated at $224,025, approximately $151 per square foot. 213 S Locust St Unit B is a home located in Kern County with nearby schools including Gateway Elementary School, Murray Middle School, and Burroughs High School.
Ownership History
Date
Name
Owned For
Owner Type
Purchase Details
Closed on
Sep 24, 2014
Sold by
Bank Of America National Association
Bought by
Furnish James K and Furnish Mary
Current Estimated Value
Home Financials for this Owner
Home Financials are based on the most recent Mortgage that was taken out on this home.
Original Mortgage
$70,125
Outstanding Balance
$23,061
Interest Rate
4.08%
Mortgage Type
New Conventional
Estimated Equity
$200,964
Purchase Details
Closed on
Jun 5, 2014
Sold by
Ford Roy F and Ford Jacqueline C
Bought by
Bank Of America National Association
Purchase Details
Closed on
Dec 20, 1994
Sold by
Labee Charles J and Labee Lori Ann
Bought by
Ford Roy F and Ford Jacqueline C
Home Financials for this Owner
Home Financials are based on the most recent Mortgage that was taken out on this home.
Original Mortgage
$62,000
Interest Rate
9.27%
Create a Home Valuation Report for This Property
The Home Valuation Report is an in-depth analysis detailing your home's value as well as a comparison with similar homes in the area
Home Values in the Area
Average Home Value in this Area
Purchase History
| Date | Buyer | Sale Price | Title Company |
|---|---|---|---|
| Furnish James K | $93,500 | Stewart Title | |
| Bank Of America National Association | $75,000 | Ticor Title | |
| Ford Roy F | $80,000 | First American Title Co |
Source: Public Records
Mortgage History
| Date | Status | Borrower | Loan Amount |
|---|---|---|---|
| Open | Furnish James K | $70,125 | |
| Previous Owner | Ford Roy F | $62,000 |
Source: Public Records
Tax History
| Year | Tax Paid | Tax Assessment Tax Assessment Total Assessment is a certain percentage of the fair market value that is determined by local assessors to be the total taxable value of land and additions on the property. | Land | Improvement |
|---|---|---|---|---|
| 2025 | $1,694 | $112,363 | $24,033 | $88,330 |
| 2024 | $1,694 | $110,161 | $23,562 | $86,599 |
| 2023 | $1,646 | $108,001 | $23,100 | $84,901 |
| 2022 | $1,612 | $105,885 | $22,648 | $83,237 |
| 2021 | $1,545 | $103,809 | $22,204 | $81,605 |
| 2020 | $1,504 | $102,746 | $21,977 | $80,769 |
| 2019 | $1,482 | $102,746 | $21,977 | $80,769 |
| 2018 | $1,457 | $98,759 | $21,125 | $77,634 |
| 2017 | $1,452 | $96,823 | $20,711 | $76,112 |
| 2016 | $1,398 | $94,925 | $20,305 | $74,620 |
| 2015 | $1,374 | $93,500 | $20,000 | $73,500 |
| 2014 | $1,438 | $109,599 | $20,544 | $89,055 |
Source: Public Records
Map
Nearby Homes
- 0 S Lumill St
- 123 S Richmond Rd
- 0 E Ridgecrest Blvd
- 343032 Ridgecrest
- 329 S Richmond Rd
- 920 E Church Ave
- 425 S Lincoln St
- Richmond 343-014-14
- 0 S Gateway Blvd
- 416 Fountain St
- 436 Fountain St
- 824 Commercial Ave
- 0 3 Commercial Properties N Downs St
- 0 Sierra Sands Unified School District Ca Unit 1 240016935
- 135 S Broadway St
- 142 Chambers St
- 0 Commercial Ave
- 508-020-01 California
- 729 N Sunland Dr Unit H
- 134 N American St
- 207 S Locust St
- 219 S Locust St
- 212 S Lilac St
- 218 S Lilac St
- 206 S Lilac St Unit B
- 201 S Locust St
- 225 S Locust St
- 212 S Locust St
- 224 S Lilac St
- 200 S Lilac St
- 218 S Locust St
- 206 S Locust St
- 231 S Locust St
- 224 S Locust St
- 200 S Locust St
- 230 S Lilac St
- 137 S Locust St
- 137 S Locust St Unit AC
- 230 S Locust St
- 148 S Lilac St
Your Personal Tour Guide
Ask me questions while you tour the home.