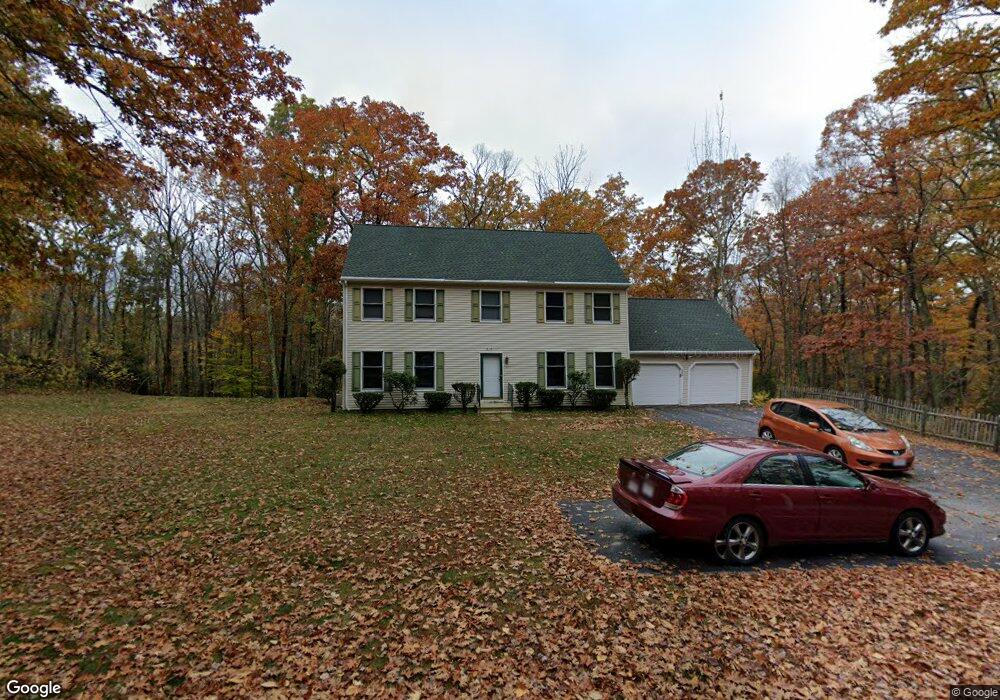
213 SE Main St Douglas, MA 01516
Estimated Value: $643,645 - $746,000
4
Beds
3
Baths
2,352
Sq Ft
$287/Sq Ft
Est. Value
About This Home
This home is located at 213 SE Main St, Douglas, MA 01516 and is currently estimated at $675,661, approximately $287 per square foot. 213 SE Main St is a home located in Worcester County with nearby schools including Douglas Primary School, Douglas Middle School, and Douglas High School.
Ownership History
Date
Name
Owned For
Owner Type
Purchase Details
Closed on
Sep 28, 1995
Sold by
Guaranteed Bldrs&Dev
Bought by
Bonneau Brian R
Current Estimated Value
Home Financials for this Owner
Home Financials are based on the most recent Mortgage that was taken out on this home.
Original Mortgage
$140,000
Interest Rate
7.89%
Mortgage Type
Purchase Money Mortgage
Create a Home Valuation Report for This Property
The Home Valuation Report is an in-depth analysis detailing your home's value as well as a comparison with similar homes in the area
Home Values in the Area
Average Home Value in this Area
Purchase History
| Date | Buyer | Sale Price | Title Company |
|---|---|---|---|
| Bonneau Brian R | $189,745 | -- |
Source: Public Records
Mortgage History
| Date | Status | Borrower | Loan Amount |
|---|---|---|---|
| Open | Bonneau Brian R | $130,000 | |
| Closed | Bonneau Brian R | $140,000 |
Source: Public Records
Tax History Compared to Growth
Tax History
| Year | Tax Paid | Tax Assessment Tax Assessment Total Assessment is a certain percentage of the fair market value that is determined by local assessors to be the total taxable value of land and additions on the property. | Land | Improvement |
|---|---|---|---|---|
| 2025 | $65 | $496,800 | $99,100 | $397,700 |
| 2024 | $6,442 | $476,500 | $90,100 | $386,400 |
| 2023 | $6,290 | $438,000 | $90,100 | $347,900 |
| 2022 | $6,443 | $394,300 | $83,300 | $311,000 |
| 2021 | $6,153 | $382,100 | $79,300 | $302,800 |
| 2020 | $6,232 | $367,000 | $79,300 | $287,700 |
| 2019 | $6,136 | $350,600 | $79,300 | $271,300 |
| 2018 | $5,494 | $341,900 | $79,300 | $262,600 |
| 2017 | $6,584 | $318,400 | $82,500 | $235,900 |
| 2016 | $5,165 | $307,100 | $82,500 | $224,600 |
| 2015 | $5,055 | $307,100 | $82,500 | $224,600 |
Source: Public Records
Map
Nearby Homes
- 183 S East Main St
- 104 Vine St
- 279 S East Main St Unit Lot 2
- 295 S East Main St Unit Lot 6
- 299 S East Main St Unit Lot 7
- 303 S East Main St Unit Lot 8
- 307 S East Main St Unit Lot 9
- 10 Essex St
- 296 Yew St
- 56 Yew St
- 99 Maple St
- 32 Hemlock St
- 0 Yew St Unit 73304926
- 38 Hemlock St
- 11 Old Farm Rd
- 0 Yew St White Ct (Lot 1) Unit 73304928
- 153 Davis St
- 10 Eagle Dr
- 59 Old Farm Rd
- 3 S East Main St
- 269 S East Main St
- 0 S East Main St
- 211 SE Main St
- 215 SE Main St
- 204 SE Main St
- 209 SE Main St
- 200 SE Main St
- 217 SE Main St
- 210 SE Main St
- 197 SE Main St
- 218 SE Main St
- 218 SE Main St
- 196 SE Main St
- 218 S East Main St
- 221 S East Main St
- 229 SE Main St
- 54 S East Main St
- 71 Locust St
- 65 Locust St
- 231 SE Main St