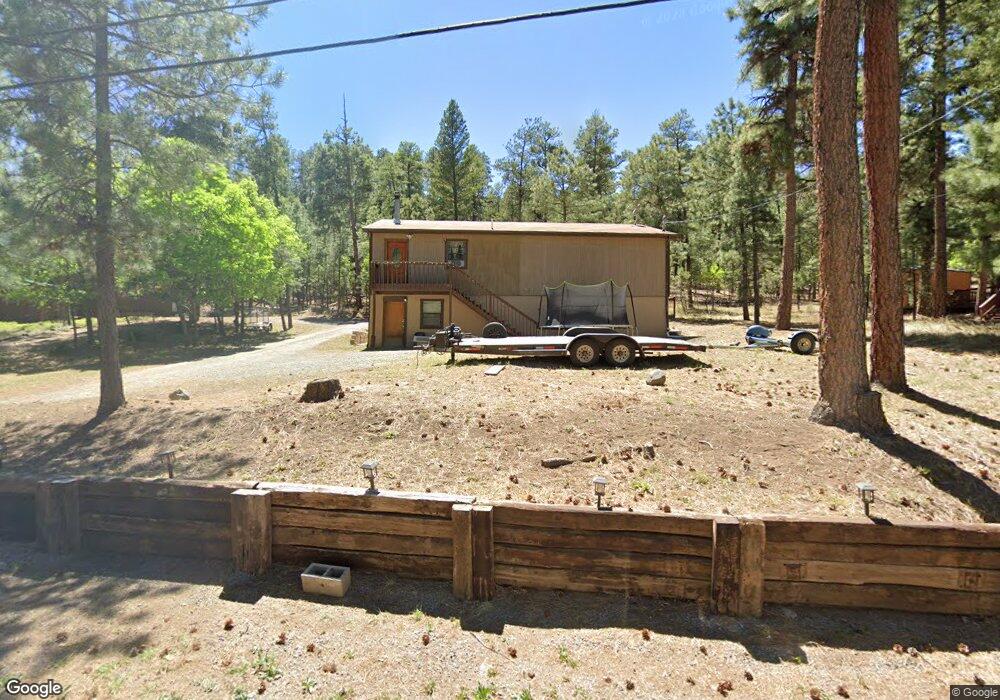
213 Sequoia Dr Ruidoso, NM 88345
Estimated Value: $339,000
3
Beds
2
Baths
1,472
Sq Ft
$230/Sq Ft
Est. Value
About This Home
This home is located at 213 Sequoia Dr, Ruidoso, NM 88345 and is currently estimated at $339,000, approximately $230 per square foot. 213 Sequoia Dr is a home located in Lincoln County with nearby schools including Sierra Vista Primary School, White Mountain Elementary School, and Ruidoso Middle School.
Ownership History
Date
Name
Owned For
Owner Type
Purchase Details
Closed on
Feb 11, 2021
Sold by
Mayberry Kevn and Burge Joy
Bought by
Mayberry Kevin and Burge Joy
Current Estimated Value
Home Financials for this Owner
Home Financials are based on the most recent Mortgage that was taken out on this home.
Original Mortgage
$210,500
Outstanding Balance
$188,913
Interest Rate
2.9%
Mortgage Type
New Conventional
Estimated Equity
$150,087
Purchase Details
Closed on
Jan 12, 2015
Sold by
Mayberry Marsha and Mayberry Kevin
Bought by
Mayberry Kevin
Home Financials for this Owner
Home Financials are based on the most recent Mortgage that was taken out on this home.
Original Mortgage
$166,000
Interest Rate
3.97%
Mortgage Type
New Conventional
Purchase Details
Closed on
Sep 15, 2010
Sold by
Goodman L Neil and Goodman Cheri E
Bought by
Mayberry Marsha and Mayberry Kevin
Purchase Details
Closed on
Feb 15, 2008
Sold by
Gowdy Mark K and Gowdy Deana L
Bought by
Goodman L Neil and Goodman Cherri E
Create a Home Valuation Report for This Property
The Home Valuation Report is an in-depth analysis detailing your home's value as well as a comparison with similar homes in the area
Home Values in the Area
Average Home Value in this Area
Purchase History
| Date | Buyer | Sale Price | Title Company |
|---|---|---|---|
| Mayberry Kevin | -- | Clearedge Title Inc | |
| Mayberry Kevin | -- | None Available | |
| Mayberry Marsha | -- | None Available | |
| Goodman L Neil | -- | Gsv |
Source: Public Records
Mortgage History
| Date | Status | Borrower | Loan Amount |
|---|---|---|---|
| Open | Mayberry Kevin | $210,500 | |
| Closed | Mayberry Kevin | $166,000 |
Source: Public Records
Tax History Compared to Growth
Tax History
| Year | Tax Paid | Tax Assessment Tax Assessment Total Assessment is a certain percentage of the fair market value that is determined by local assessors to be the total taxable value of land and additions on the property. | Land | Improvement |
|---|---|---|---|---|
| 2025 | $2,469 | $10,908 | $10,908 | $0 |
| 2024 | $2,469 | $10,908 | $10,908 | $0 |
| 2023 | $2,469 | $79,725 | $14,120 | $65,605 |
| 2022 | $2,340 | $77,403 | $13,709 | $63,694 |
| 2021 | $2,261 | $75,142 | $13,309 | $61,833 |
| 2020 | $2,215 | $72,953 | $12,921 | $60,032 |
| 2019 | $2,073 | $71,523 | $12,668 | $58,855 |
| 2018 | $2,000 | $69,440 | $12,299 | $57,141 |
| 2017 | $1,925 | $67,418 | $11,941 | $55,477 |
| 2015 | $1,873 | $65,461 | $11,594 | $53,867 |
| 2014 | $1,819 | $63,554 | $11,256 | $52,298 |
Source: Public Records
Map
Nearby Homes
- 112 Olympia Rd
- 210 Sandia Rd
- 200 Alpine Village Rd
- 102 Cliffside Rd
- Lots 5-9 Alpine Village Rd
- 110 Tahoe Dr
- Lot 11 Alpine Village Rd
- Lot 10 Alpine Village Rd
- Lot 8A Alpine Village Rd
- 0 Tonto Dr
- 117 Tonto Dr
- 107 Cibola Cir
- 126 Leon Farrar Dr
- Lot 34 Chiracahua Ln
- Lot 33 Chiracahua Ln
- 1451 Mechem Dr
- 111 Tall Pines Rd
- LOT 34 Telluride Trail
- 140 Telluride Trail
- 106 Plumas Place