213 Sheridan St Gordon, NE 69343
Estimated Value: $74,000 - $96,000
3
Beds
2
Baths
1,408
Sq Ft
$60/Sq Ft
Est. Value
About This Home
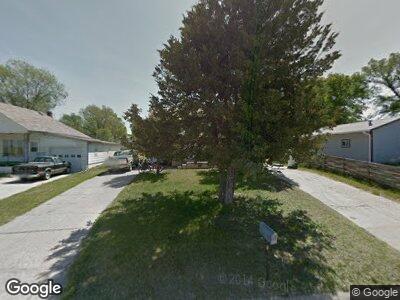
This home is located at 213 Sheridan St, Gordon, NE 69343 and is currently estimated at $85,000, approximately $60 per square foot. 213 Sheridan St is a home located in Sheridan County with nearby schools including Gordon-Rushville High School.
Create a Home Valuation Report for This Property
The Home Valuation Report is an in-depth analysis detailing your home's value as well as a comparison with similar homes in the area
Home Values in the Area
Average Home Value in this Area
Tax History Compared to Growth
Tax History
| Year | Tax Paid | Tax Assessment Tax Assessment Total Assessment is a certain percentage of the fair market value that is determined by local assessors to be the total taxable value of land and additions on the property. | Land | Improvement |
|---|---|---|---|---|
| 2024 | $700 | $56,836 | $3,480 | $53,356 |
| 2023 | $928 | $54,658 | $3,480 | $51,178 |
| 2022 | $809 | $42,426 | $3,480 | $38,946 |
| 2021 | $811 | $42,426 | $3,480 | $38,946 |
| 2020 | $567 | $28,558 | $3,480 | $25,078 |
| 2019 | $493 | $25,871 | $3,480 | $22,391 |
| 2018 | $489 | $25,981 | $3,480 | $22,501 |
| 2017 | $458 | $24,036 | $3,584 | $20,452 |
| 2016 | $472 | $24,036 | $3,584 | $20,452 |
| 2015 | $442 | $22,116 | $3,584 | $18,532 |
| 2014 | $397 | $18,450 | $3,584 | $14,866 |
| 2012 | -- | $29,343 | $3,480 | $25,863 |
Source: Public Records
Map
Nearby Homes
- 178 N Cornell St
- 202 W 5th St
- 31800 U S 20
- 704 N Oak St
- 513 N Main St
- 416 W 10th St
- 112 E 8th St
- 507 E 6th St
- 0 Gordon Small Acreage Unit 11320739
- 0 Rushville Hobby Farm Unit 11288249
- 116 Chamberlain Ave
- 503 E 4th St
- 306 Larimer St
- 402 Chamberlain St
- 406 Chamberlain St
- 201 E 3rd St
- 309 Loofborrow St
- 407 S Main St
- 7398 325th Trail
- 7121 State Highway 87