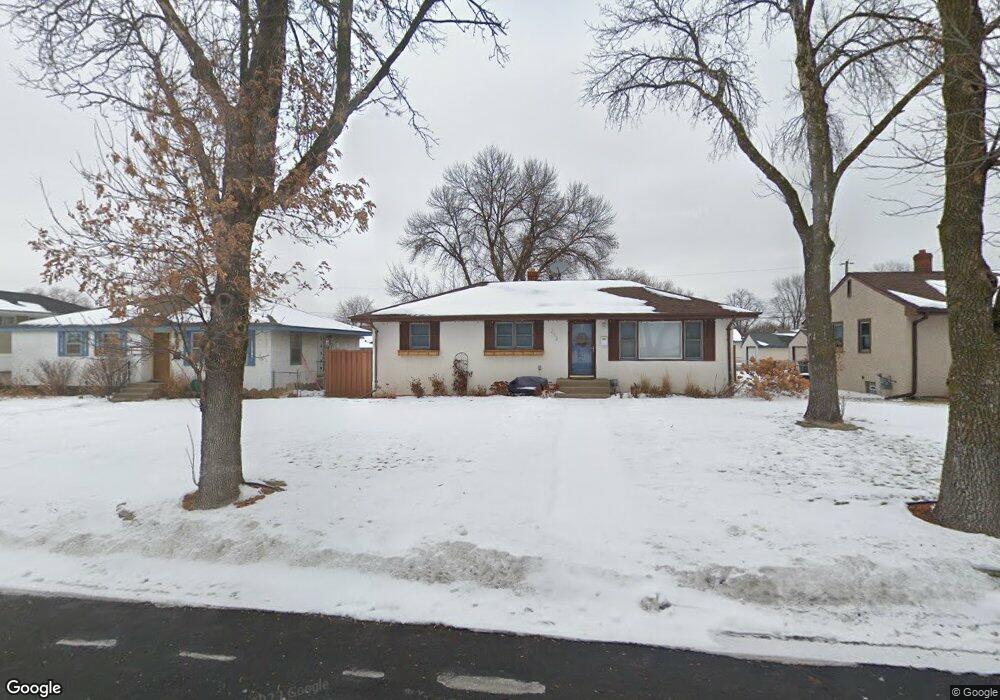
213 South St E South St. Paul, MN 55075
Estimated Value: $319,000 - $325,000
1
Bed
2
Baths
1,073
Sq Ft
$301/Sq Ft
Est. Value
About This Home
This home is located at 213 South St E, South St. Paul, MN 55075 and is currently estimated at $322,750, approximately $300 per square foot. 213 South St E is a home located in Dakota County with nearby schools including Kaposia Education Center Elementary, South St. Paul Secondary, and Discovery Charter School.
Ownership History
Date
Name
Owned For
Owner Type
Purchase Details
Closed on
Aug 5, 2016
Sold by
Bear Nicholas Joseph and Bear Megan Rose
Bought by
Neilson Chelsea and Jones Jason
Current Estimated Value
Home Financials for this Owner
Home Financials are based on the most recent Mortgage that was taken out on this home.
Original Mortgage
$207,100
Outstanding Balance
$165,242
Interest Rate
3.48%
Mortgage Type
New Conventional
Estimated Equity
$157,508
Purchase Details
Closed on
May 29, 2009
Sold by
Bade Properties Llc
Bought by
Bear Nicholas J and Jutting Megan N
Home Financials for this Owner
Home Financials are based on the most recent Mortgage that was taken out on this home.
Original Mortgage
$181,649
Interest Rate
4.83%
Mortgage Type
FHA
Purchase Details
Closed on
Feb 11, 2009
Sold by
Deutsche Bank National Trust Co
Bought by
Bade Properties Llc
Purchase Details
Closed on
Jan 30, 2004
Sold by
Franklund Duane E and Franklund Kathy
Bought by
Cermeno Morales Vicente
Purchase Details
Closed on
Sep 27, 2001
Sold by
Eckman Bruce A and Eckman Ricci Coreen
Bought by
Franklund Duane E and Franklund Kathy
Create a Home Valuation Report for This Property
The Home Valuation Report is an in-depth analysis detailing your home's value as well as a comparison with similar homes in the area
Home Values in the Area
Average Home Value in this Area
Purchase History
| Date | Buyer | Sale Price | Title Company |
|---|---|---|---|
| Neilson Chelsea | $218,000 | Home Title Inc | |
| Bear Nicholas J | $92,500 | -- | |
| Bear Nicholas J | $92,500 | -- | |
| Bade Properties Llc | $102,000 | -- | |
| Cermeno Morales Vicente | $209,000 | -- | |
| Franklund Duane E | $179,000 | -- |
Source: Public Records
Mortgage History
| Date | Status | Borrower | Loan Amount |
|---|---|---|---|
| Open | Neilson Chelsea | $207,100 | |
| Previous Owner | Bear Nicholas J | $181,649 |
Source: Public Records
Tax History Compared to Growth
Tax History
| Year | Tax Paid | Tax Assessment Tax Assessment Total Assessment is a certain percentage of the fair market value that is determined by local assessors to be the total taxable value of land and additions on the property. | Land | Improvement |
|---|---|---|---|---|
| 2024 | $1,796 | $285,600 | $66,200 | $219,400 |
| 2023 | $1,796 | $278,300 | $66,600 | $211,700 |
| 2022 | $1,310 | $278,600 | $66,500 | $212,100 |
| 2021 | $1,094 | $244,100 | $57,900 | $186,200 |
| 2020 | $934 | $227,000 | $55,100 | $171,900 |
| 2019 | $580 | $217,500 | $52,500 | $165,000 |
| 2018 | $2,380 | $190,000 | $47,700 | $142,300 |
| 2017 | $2,075 | $175,400 | $45,500 | $129,900 |
| 2016 | $2,066 | $159,800 | $41,300 | $118,500 |
| 2015 | $1,914 | $130,075 | $33,387 | $96,688 |
| 2014 | -- | $127,786 | $33,255 | $94,531 |
| 2013 | -- | $116,123 | $28,556 | $87,567 |
Source: Public Records
Map
Nearby Homes
- 137 South St E
- 1403 Concord St S Unit 1
- 101 Frost St W
- 1436 5th Ave S
- 1456 6th Ave S
- 233 Richmond St W
- 100 W Warburton St
- 1434 8th Ave S
- 6051 Concord Blvd
- 6050 Cahill Ave
- 1215 8th Ave S
- 151 Park St W
- 5472 Bryce Ave
- 5938 Burke Trail
- 1127 9th Ave S
- 6445 Coryell Ct
- 4020 64th St E
- 5903 Bryant Ln
- 6425 Delilah Ave
- 928 8th Ave S