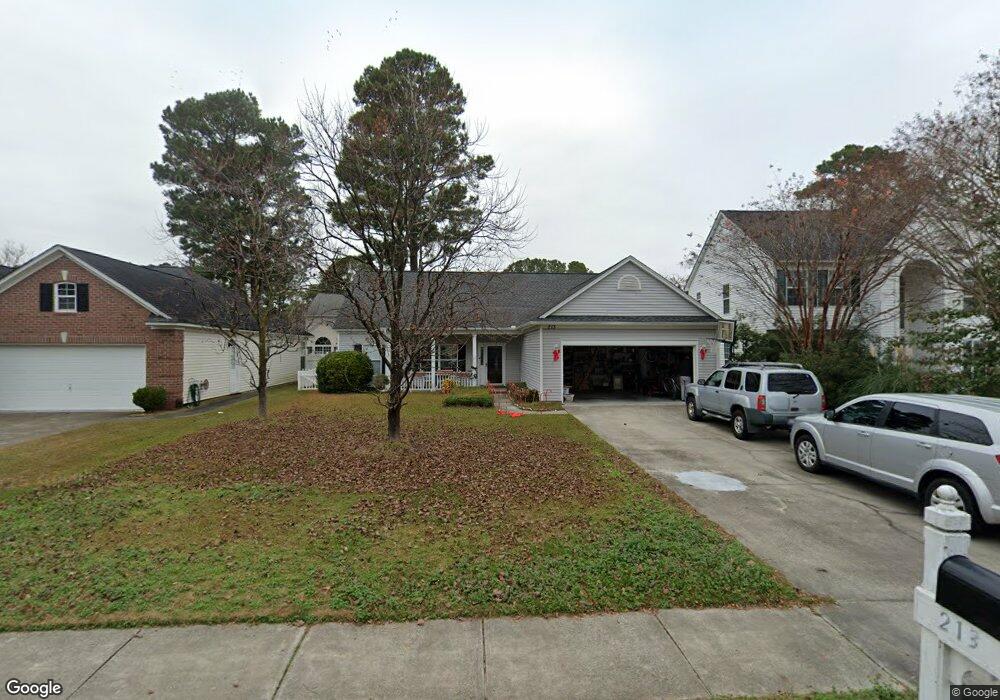
213 Springlake Dr Myrtle Beach, SC 29579
Estimated Value: $305,000 - $343,000
3
Beds
2
Baths
1,586
Sq Ft
$201/Sq Ft
Est. Value
About This Home
This home is located at 213 Springlake Dr, Myrtle Beach, SC 29579 and is currently estimated at $318,943, approximately $201 per square foot. 213 Springlake Dr is a home located in Horry County with nearby schools including Carolina Forest Elementary School, Ten Oaks Middle, and Carolina Forest High School.
Ownership History
Date
Name
Owned For
Owner Type
Purchase Details
Closed on
Sep 9, 2004
Sold by
Sargent Scot M and Sargent Tina L
Bought by
Ender Hamid and Ender Gonca
Current Estimated Value
Home Financials for this Owner
Home Financials are based on the most recent Mortgage that was taken out on this home.
Original Mortgage
$142,500
Outstanding Balance
$70,126
Interest Rate
5.78%
Mortgage Type
New Conventional
Estimated Equity
$248,817
Purchase Details
Closed on
Apr 14, 2000
Sold by
Centex Homes
Bought by
Sargent Scot M and Sargent Tina L
Home Financials for this Owner
Home Financials are based on the most recent Mortgage that was taken out on this home.
Original Mortgage
$132,500
Interest Rate
7.62%
Mortgage Type
Unknown
Purchase Details
Closed on
Nov 20, 1998
Sold by
Springlake Development Company Inc
Bought by
Centex Homes
Create a Home Valuation Report for This Property
The Home Valuation Report is an in-depth analysis detailing your home's value as well as a comparison with similar homes in the area
Home Values in the Area
Average Home Value in this Area
Purchase History
| Date | Buyer | Sale Price | Title Company |
|---|---|---|---|
| Ender Hamid | $150,000 | -- | |
| Sargent Scot M | $139,475 | -- | |
| Centex Homes | $118,806 | -- |
Source: Public Records
Mortgage History
| Date | Status | Borrower | Loan Amount |
|---|---|---|---|
| Open | Ender Hamid | $142,500 | |
| Previous Owner | Sargent Scot M | $132,500 |
Source: Public Records
Tax History Compared to Growth
Tax History
| Year | Tax Paid | Tax Assessment Tax Assessment Total Assessment is a certain percentage of the fair market value that is determined by local assessors to be the total taxable value of land and additions on the property. | Land | Improvement |
|---|---|---|---|---|
| 2024 | $946 | $12,577 | $4,800 | $7,777 |
| 2023 | $946 | $8,107 | $1,650 | $6,457 |
| 2021 | $857 | $9,509 | $1,809 | $7,700 |
| 2020 | $750 | $9,509 | $1,809 | $7,700 |
| 2019 | $750 | $9,509 | $1,809 | $7,700 |
| 2018 | $676 | $7,050 | $1,434 | $5,616 |
| 2017 | $661 | $7,050 | $1,434 | $5,616 |
| 2016 | -- | $7,050 | $1,434 | $5,616 |
| 2015 | $661 | $7,050 | $1,434 | $5,616 |
| 2014 | $610 | $7,050 | $1,434 | $5,616 |
Source: Public Records
Map
Nearby Homes
- 463 Springlake Dr
- 490 Blackberry Ln
- 4800 New Haven Ct
- 4818 Harvest Dr
- 105 Ashley Park Dr Unit 2-E
- 4826 Keel Ct
- 629 Slash Pine Ct
- 4905 Britewater Ct Unit 202
- 4907 Britewater Ct Unit 102
- 4909 Britewater Ct Unit 202
- 2384 Covington Dr
- 553 Linton Park Rd
- 4920 Twin Pond Ct Unit CT202
- 4190 Setter Ct
- 4913 Twin Pond Ct Unit 202
- 4930 Windsor Green Way Unit 301
- 4917 Twin Pond Ct Unit 102
- 129 Ashley Park Dr Unit 7 C
- 4924 Pond Shoals Ct Unit 101 Windsor Green
- 523 Stonemason Dr
- 215 Springlake Dr Unit 215 Spring Lake Dr.
- 215 Springlake Dr
- 211 Springlake Dr
- 217 Springlake Dr
- 217 Spring Lake Dr
- 423 Blackberry Ln
- 425 Blackberry Ln
- 209 Springlake Dr
- 209 Spring Lake Dr
- 421 Blackberry Ln
- 212 Spring Lake Dr
- 427 Blackberry Ln
- 520 Snapdragon Ct
- 419 Blackberry Ln
- 207 Springlake Dr
- 219 Springlake Dr
- 429 Blackberry Ln
- 417 Blackberry Ln
- 522 Snapdragon Ct
- 205 Springlake Dr