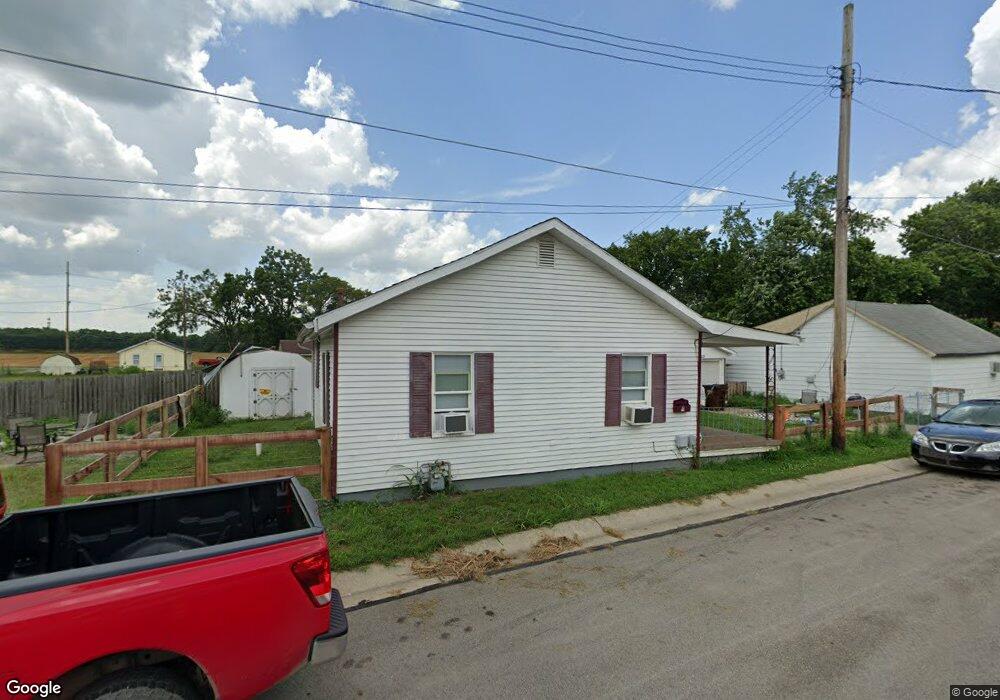
213 Sycamore St Franklin, OH 45005
Estimated Value: $101,619 - $178,000
2
Beds
1
Bath
696
Sq Ft
$215/Sq Ft
Est. Value
About This Home
This home is located at 213 Sycamore St, Franklin, OH 45005 and is currently estimated at $149,655, approximately $215 per square foot. 213 Sycamore St is a home located in Warren County with nearby schools including Franklin High School.
Ownership History
Date
Name
Owned For
Owner Type
Purchase Details
Closed on
Oct 20, 2006
Sold by
Fannie Mae
Bought by
Cockerham Maudie and Neace Elsie
Current Estimated Value
Purchase Details
Closed on
Dec 28, 2005
Sold by
Lamb Danny D and Lamb Betty J
Bought by
Federal National Mortgage Association
Purchase Details
Closed on
Nov 14, 1997
Sold by
Federal National Mortgag
Bought by
Lamb Danny D and Lamb Betty J
Home Financials for this Owner
Home Financials are based on the most recent Mortgage that was taken out on this home.
Original Mortgage
$31,500
Interest Rate
7.43%
Mortgage Type
New Conventional
Purchase Details
Closed on
May 27, 1997
Sold by
Worrell Diane
Bought by
Huntington Mortgage Co
Purchase Details
Closed on
Aug 18, 1986
Sold by
Nerva Clemmons and Nerva Jane
Bought by
Worrell Worrell and Worrell Diane
Create a Home Valuation Report for This Property
The Home Valuation Report is an in-depth analysis detailing your home's value as well as a comparison with similar homes in the area
Home Values in the Area
Average Home Value in this Area
Purchase History
| Date | Buyer | Sale Price | Title Company |
|---|---|---|---|
| Cockerham Maudie | -- | Midland Title Froelke | |
| Federal National Mortgage Association | $26,667 | None Available | |
| Lamb Danny D | $35,000 | -- | |
| Huntington Mortgage Co | $32,000 | -- | |
| Worrell Worrell | -- | -- |
Source: Public Records
Mortgage History
| Date | Status | Borrower | Loan Amount |
|---|---|---|---|
| Previous Owner | Lamb Danny D | $31,500 |
Source: Public Records
Tax History Compared to Growth
Tax History
| Year | Tax Paid | Tax Assessment Tax Assessment Total Assessment is a certain percentage of the fair market value that is determined by local assessors to be the total taxable value of land and additions on the property. | Land | Improvement |
|---|---|---|---|---|
| 2024 | $974 | $19,880 | $2,160 | $17,720 |
| 2023 | $860 | $15,879 | $2,089 | $13,790 |
| 2022 | $844 | $15,880 | $2,090 | $13,790 |
| 2021 | $800 | $15,880 | $2,090 | $13,790 |
| 2020 | $769 | $13,458 | $1,771 | $11,687 |
| 2019 | $702 | $13,458 | $1,771 | $11,687 |
| 2018 | $703 | $13,458 | $1,771 | $11,687 |
| 2017 | $756 | $13,269 | $1,775 | $11,494 |
| 2016 | $771 | $13,269 | $1,775 | $11,494 |
| 2015 | $771 | $13,269 | $1,775 | $11,494 |
| 2014 | $772 | $13,270 | $1,770 | $11,490 |
| 2013 | $666 | $14,710 | $1,970 | $12,740 |
Source: Public Records
Map
Nearby Homes
- 105 Chestnut St Unit 1
- 605 Spring Ave
- 1504 Knightsbridge Ct
- 20 Timber Creek Dr
- 1215 Waterbury Dr
- 1221 Waterbury Dr
- 1227 Waterbury Dr
- 90 Timber Creek Dr
- 95 Timber Creek Dr
- 430 Central Ave
- 627 S River St
- 631 S River St
- 0 Oxford Rd
- 185 Christina Way
- 315 Bridge St
- 521 S Main St
- 0 E 4th St
- 233 S Main St
- 235 S Main St
- 380 Clear Springs Ct