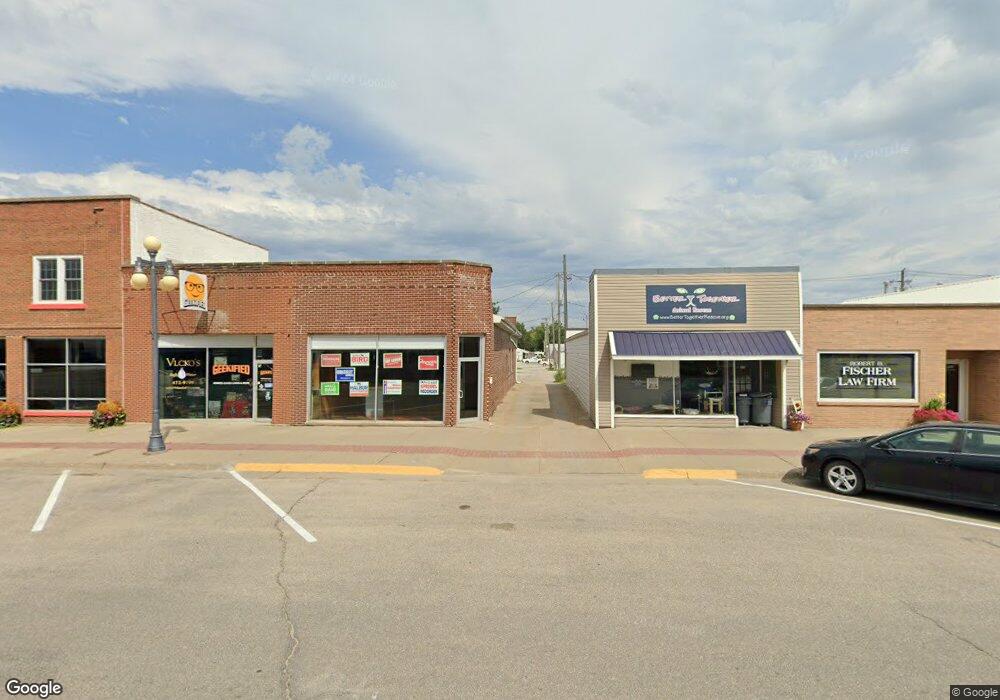
213 W 4th St Vinton, IA 52349
Estimated Value: $72,666
--
Bed
--
Bath
2,870
Sq Ft
$25/Sq Ft
Est. Value
About This Home
This home is located at 213 W 4th St, Vinton, IA 52349 and is currently estimated at $72,666, approximately $25 per square foot. 213 W 4th St is a home located in Benton County with nearby schools including Tilford Elementary School, Shellsburg Elementary School, and Vinton-Shellsburg Middle School.
Ownership History
Date
Name
Owned For
Owner Type
Purchase Details
Closed on
Aug 15, 2025
Sold by
M & B Investments Llc
Bought by
Happy Pizza People Llc
Current Estimated Value
Home Financials for this Owner
Home Financials are based on the most recent Mortgage that was taken out on this home.
Original Mortgage
$132,552
Outstanding Balance
$129,218
Interest Rate
6.72%
Mortgage Type
Credit Line Revolving
Estimated Equity
-$56,552
Purchase Details
Closed on
Dec 30, 2004
Sold by
Authier Brenda L and Authier Kirk L
Bought by
Matus James Allen and Matus Wanda G Albert
Create a Home Valuation Report for This Property
The Home Valuation Report is an in-depth analysis detailing your home's value as well as a comparison with similar homes in the area
Home Values in the Area
Average Home Value in this Area
Purchase History
| Date | Buyer | Sale Price | Title Company |
|---|---|---|---|
| Happy Pizza People Llc | $118,000 | None Listed On Document | |
| Matus James Allen | -- | None Available |
Source: Public Records
Mortgage History
| Date | Status | Borrower | Loan Amount |
|---|---|---|---|
| Open | Happy Pizza People Llc | $132,552 |
Source: Public Records
Tax History Compared to Growth
Tax History
| Year | Tax Paid | Tax Assessment Tax Assessment Total Assessment is a certain percentage of the fair market value that is determined by local assessors to be the total taxable value of land and additions on the property. | Land | Improvement |
|---|---|---|---|---|
| 2025 | $932 | $118,900 | $13,000 | $105,900 |
| 2024 | $932 | $49,700 | $13,000 | $36,700 |
| 2023 | $1,916 | $90,900 | $13,000 | $77,900 |
| 2022 | $1,966 | $89,000 | $10,400 | $78,600 |
| 2021 | $1,966 | $89,000 | $10,400 | $78,600 |
| 2020 | $2,054 | $94,900 | $11,900 | $83,000 |
| 2019 | $1,612 | $83,200 | $10,400 | $72,800 |
| 2018 | $1,566 | $73,500 | $10,400 | $63,100 |
| 2017 | $1,566 | $73,500 | $10,400 | $63,100 |
| 2016 | $826 | $38,300 | $11,400 | $26,900 |
| 2015 | $826 | $38,300 | $11,400 | $26,900 |
| 2014 | $828 | $38,300 | $0 | $0 |
Source: Public Records
Map
Nearby Homes