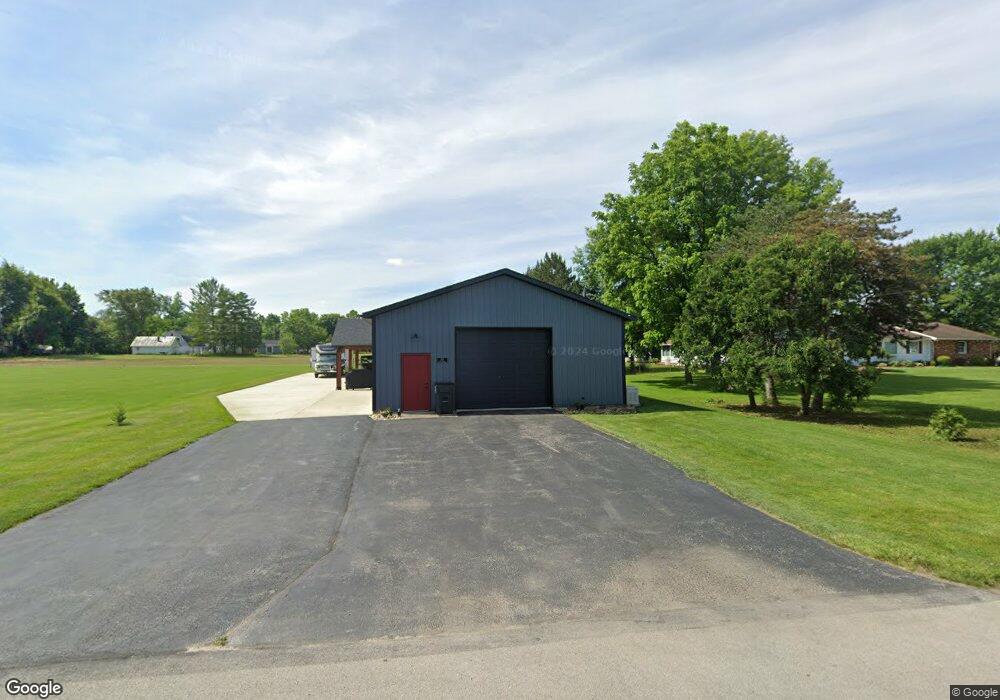
213 W Euclid St Green Springs, OH 44836
Estimated Value: $197,000 - $343,000
1
Bed
2
Baths
3,200
Sq Ft
$82/Sq Ft
Est. Value
About This Home
This home is located at 213 W Euclid St, Green Springs, OH 44836 and is currently estimated at $260,847, approximately $81 per square foot. 213 W Euclid St is a home located in Seneca County with nearby schools including Clyde High School.
Ownership History
Date
Name
Owned For
Owner Type
Purchase Details
Closed on
Sep 26, 2017
Sold by
Myers Todd E
Bought by
Sessler Steven M and Sessler Lynne I
Current Estimated Value
Home Financials for this Owner
Home Financials are based on the most recent Mortgage that was taken out on this home.
Original Mortgage
$64,000
Interest Rate
3.82%
Mortgage Type
New Conventional
Purchase Details
Closed on
Jun 23, 2006
Sold by
Myers Todd E
Bought by
Burgos Angel R and Burgos Andrea K
Home Financials for this Owner
Home Financials are based on the most recent Mortgage that was taken out on this home.
Original Mortgage
$180,420
Outstanding Balance
$106,724
Interest Rate
6.68%
Mortgage Type
New Conventional
Estimated Equity
$154,123
Purchase Details
Closed on
Jun 26, 1997
Bought by
Myers Todd E
Purchase Details
Closed on
Feb 6, 1997
Sold by
Myers Kenneth E
Bought by
Croghan Colonial Bank Trustee The
Purchase Details
Closed on
Nov 30, 1990
Create a Home Valuation Report for This Property
The Home Valuation Report is an in-depth analysis detailing your home's value as well as a comparison with similar homes in the area
Home Values in the Area
Average Home Value in this Area
Purchase History
| Date | Buyer | Sale Price | Title Company |
|---|---|---|---|
| Sessler Steven M | $80,000 | Assured Title | |
| Burgos Angel R | $186,000 | None Available | |
| Myers Todd E | $121,400 | -- | |
| Croghan Colonial Bank Trustee The | -- | -- | |
| -- | -- | -- |
Source: Public Records
Mortgage History
| Date | Status | Borrower | Loan Amount |
|---|---|---|---|
| Closed | Sessler Steven M | $64,000 | |
| Open | Burgos Angel R | $180,420 |
Source: Public Records
Tax History Compared to Growth
Tax History
| Year | Tax Paid | Tax Assessment Tax Assessment Total Assessment is a certain percentage of the fair market value that is determined by local assessors to be the total taxable value of land and additions on the property. | Land | Improvement |
|---|---|---|---|---|
| 2024 | $2,860 | $63,230 | $8,350 | $54,880 |
| 2023 | $3,017 | $63,230 | $8,350 | $54,880 |
| 2022 | $753 | $14,360 | $6,140 | $8,220 |
| 2021 | $762 | $14,360 | $6,140 | $8,220 |
| 2020 | $781 | $14,361 | $6,143 | $8,218 |
| 2019 | $865 | $16,279 | $6,962 | $9,317 |
| 2018 | $864 | $16,279 | $6,962 | $9,317 |
| 2017 | $577 | $11,088 | $5,040 | $6,048 |
| 2016 | $555 | $11,585 | $5,005 | $6,580 |
| 2015 | $549 | $11,585 | $5,005 | $6,580 |
| 2014 | $475 | $11,585 | $5,005 | $6,580 |
| 2013 | -- | $11,743 | $5,163 | $6,580 |
Source: Public Records
Map
Nearby Homes
- 104 Ken Lee Dr
- 220 Maple Ln Unit 82
- 0 N Sr 101 Unit 20252008
- 236 Spayd Rd
- 2114 S Main St
- 0 Merlin Ln Unit 20253762
- 0 Merlin Ln Unit 20253639
- 628 W Maple St
- V/L County Road 220
- 0 County Road 220
- 322 Vine St
- 209 Fair St
- 2314 E Sr 20
- 1270 W Mcpherson Hwy
- 235 W Buckeye St
- 761 N Woodland Ave
- 18 Katlyn Dr
- 3656 N County Road 43
- 222 Bertha Ave
- 933 E Cole Rd
- 215 W Euclid St
- 212 W Euclid St
- 214 W Euclid St
- 0 W Euclid St
- 220 W Euclid St
- 218 W Euclid St
- 208 W Euclid St
- 206 W Euclid St
- 300 W Euclid St
- 109 111 W
- 205 S Kansas St
- 205 S Kansas St
- 115 S Kansas St
- 111 S Kansas St
- 211 S Kansas St
- 302 W Euclid St
- 215 W Adams St
- 213 W Adams St
- 217 W Adams St
- 209 W Adams St