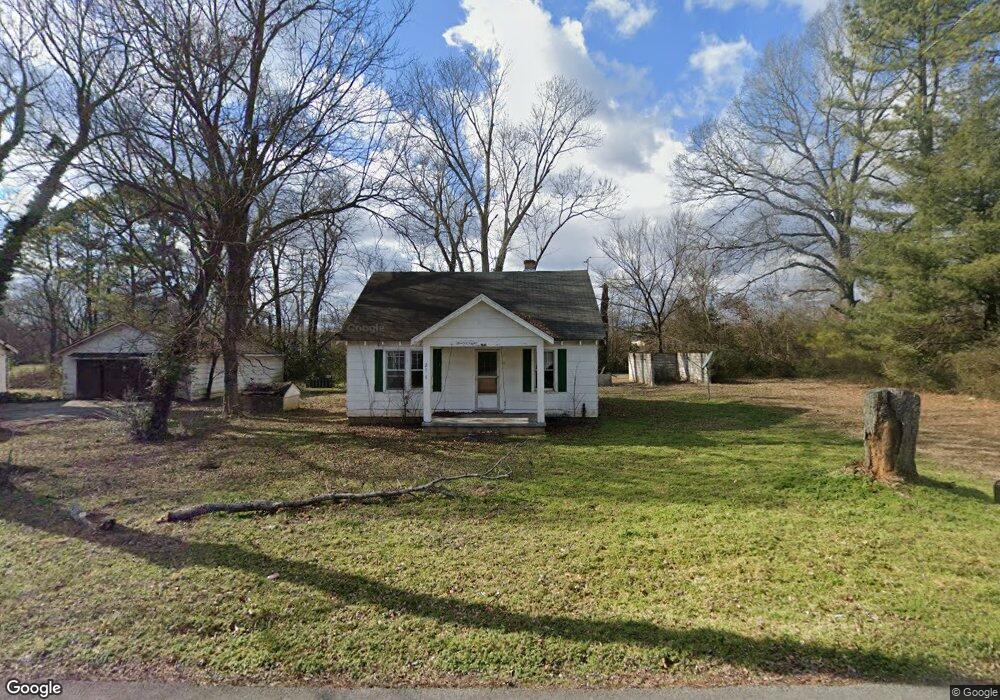
213 Yearwood Ave Murfreesboro, TN 37130
Estimated Value: $218,001 - $260,000
--
Bed
1
Bath
812
Sq Ft
$292/Sq Ft
Est. Value
About This Home
This home is located at 213 Yearwood Ave, Murfreesboro, TN 37130 and is currently estimated at $236,750, approximately $291 per square foot. 213 Yearwood Ave is a home located in Rutherford County with nearby schools including Hobgood Elementary School, Kittrell Elementary School, and Whitworth-Buchanan Middle School.
Ownership History
Date
Name
Owned For
Owner Type
Purchase Details
Closed on
Aug 15, 2025
Sold by
Greenland Partners Llc
Bought by
Csc Murfreesboro Mtsu Llc
Current Estimated Value
Home Financials for this Owner
Home Financials are based on the most recent Mortgage that was taken out on this home.
Original Mortgage
$2,274,535
Outstanding Balance
$2,204,722
Interest Rate
6.75%
Mortgage Type
Credit Line Revolving
Estimated Equity
-$1,967,972
Purchase Details
Closed on
Oct 24, 2018
Sold by
Wlf Properties Inc
Bought by
Greenland Partners Llc
Home Financials for this Owner
Home Financials are based on the most recent Mortgage that was taken out on this home.
Original Mortgage
$544,850
Interest Rate
4.6%
Mortgage Type
Commercial
Purchase Details
Closed on
Dec 20, 2007
Sold by
Lf Properties Inc
Bought by
Wlf Properties Inc
Purchase Details
Closed on
Dec 15, 2005
Sold by
Ross Hixson Mary
Bought by
L F Properties Inc
Create a Home Valuation Report for This Property
The Home Valuation Report is an in-depth analysis detailing your home's value as well as a comparison with similar homes in the area
Home Values in the Area
Average Home Value in this Area
Purchase History
| Date | Buyer | Sale Price | Title Company |
|---|---|---|---|
| Csc Murfreesboro Mtsu Llc | $475,000 | Lawyers Land & Title | |
| Greenland Partners Llc | $575,000 | None Available | |
| Wlf Properties Inc | $194,000 | -- | |
| L F Properties Inc | $178,000 | -- |
Source: Public Records
Mortgage History
| Date | Status | Borrower | Loan Amount |
|---|---|---|---|
| Open | Csc Murfreesboro Mtsu Llc | $2,274,535 | |
| Previous Owner | Greenland Partners Llc | $544,850 |
Source: Public Records
Tax History Compared to Growth
Tax History
| Year | Tax Paid | Tax Assessment Tax Assessment Total Assessment is a certain percentage of the fair market value that is determined by local assessors to be the total taxable value of land and additions on the property. | Land | Improvement |
|---|---|---|---|---|
| 2025 | $1,083 | $38,275 | $13,750 | $24,525 |
| 2024 | $1,083 | $38,275 | $13,750 | $24,525 |
| 2023 | $718 | $38,275 | $13,750 | $24,525 |
| 2022 | $619 | $38,275 | $13,750 | $24,525 |
| 2021 | $479 | $21,600 | $8,125 | $13,475 |
| 2020 | $479 | $21,600 | $8,125 | $13,475 |
| 2019 | $479 | $21,600 | $8,125 | $13,475 |
| 2018 | $453 | $21,600 | $0 | $0 |
| 2017 | $439 | $16,375 | $0 | $0 |
| 2016 | $439 | $16,375 | $0 | $0 |
| 2015 | $439 | $16,375 | $0 | $0 |
| 2014 | $407 | $16,375 | $0 | $0 |
| 2013 | -- | $15,550 | $0 | $0 |
Source: Public Records
Map
Nearby Homes
- 316 Yearwood Ave
- 2407 E Main St
- 2420 Central Blvd
- 123 Juliet Ave
- 2519 E Main St
- 5485 John Bragg Hwy
- 706 N Rutherford Blvd
- 703 Chickasaw Rd
- 411 Apollo Dr
- 1907 Wren St
- 3410 E Main St
- 615 Cardinal Dr
- 1522 Dr Martin Luther King jr Blvd
- 0 Double Springs Rd
- 1430 E Main St
- 1511 Diana St
- 2514 Keegan Dr
- 1005 Empire Blvd
- 313 Tyne Ave
- 1029 Empire Blvd
- 209 Yearwood Ave
- 0 Yearwood Ave
- 232 N Rutherford Blvd
- 219 Yearwood Ave
- 207 Yearwood Ave
- 214 Yearwood Ave
- 210 Yearwood Ave
- 208 Yearwood Ave
- 205 Yearwood Ave
- 218 Yearwood Ave
- 206 Yearwood Ave
- 203 Yearwood Ave
- 2411 Anchor St
- 204 Yearwood Ave
- 303 Yearwood Ave
- 2415 Anchor St
- 225 N Rutherford Blvd
- 2402 Central Blvd
- 0 W Rutherford Blvd Unit 1927938
- 0 S Rutherford Unit 1831839