2130 21st St Gering, NE 69341
Estimated Value: $278,717 - $354,000
2
Beds
2
Baths
1,526
Sq Ft
$201/Sq Ft
Est. Value
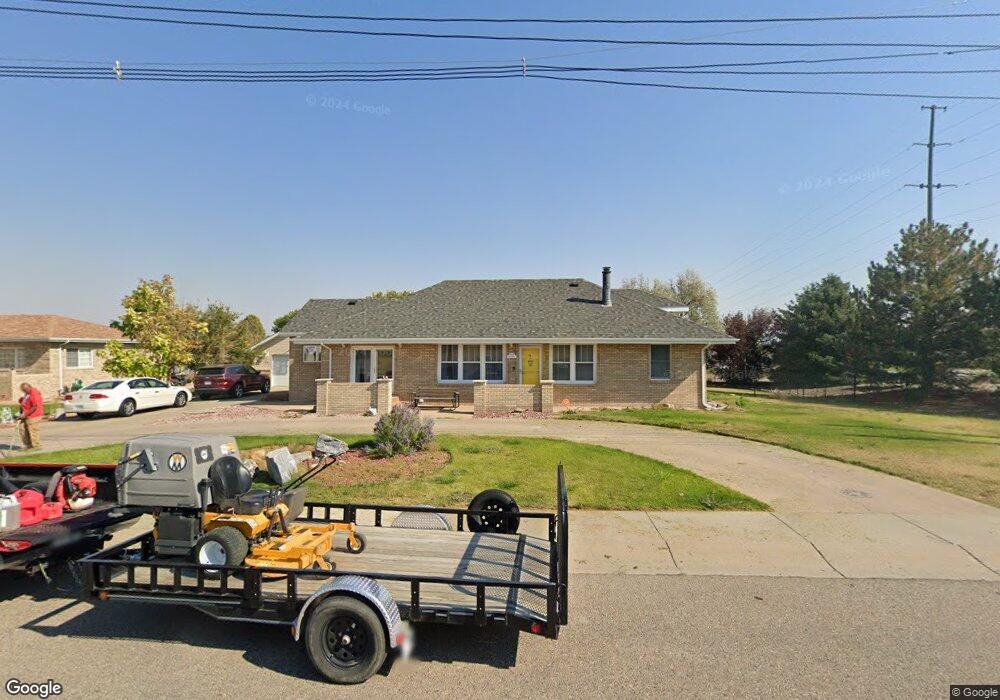
About This Home
This home is located at 2130 21st St, Gering, NE 69341 and is currently estimated at $307,179, approximately $201 per square foot. 2130 21st St is a home located in Scotts Bluff County with nearby schools including Gering High School and Community Christian Elementary/Middle School.
Ownership History
Date
Name
Owned For
Owner Type
Purchase Details
Closed on
Aug 17, 2022
Sold by
Bradley and Kobie
Bought by
Mitchell Adam J
Current Estimated Value
Home Financials for this Owner
Home Financials are based on the most recent Mortgage that was taken out on this home.
Original Mortgage
$284,900
Outstanding Balance
$271,918
Interest Rate
5.3%
Mortgage Type
VA
Estimated Equity
$35,261
Purchase Details
Closed on
Jun 18, 2021
Sold by
Reed & Wilson Investments Llc
Bought by
Bradley Morgan and Meininger Linda
Home Financials for this Owner
Home Financials are based on the most recent Mortgage that was taken out on this home.
Original Mortgage
$184,692
Interest Rate
2.9%
Mortgage Type
FHA
Create a Home Valuation Report for This Property
The Home Valuation Report is an in-depth analysis detailing your home's value as well as a comparison with similar homes in the area
Home Values in the Area
Average Home Value in this Area
Purchase History
| Date | Buyer | Sale Price | Title Company |
|---|---|---|---|
| Mitchell Adam J | $275,000 | Nebraska Title | |
| Bradley Morgan | $189,000 | Nebraska Ttl Co Scottsbluff |
Source: Public Records
Mortgage History
| Date | Status | Borrower | Loan Amount |
|---|---|---|---|
| Open | Mitchell Adam J | $284,900 | |
| Previous Owner | Bradley Morgan | $184,692 |
Source: Public Records
Tax History Compared to Growth
Tax History
| Year | Tax Paid | Tax Assessment Tax Assessment Total Assessment is a certain percentage of the fair market value that is determined by local assessors to be the total taxable value of land and additions on the property. | Land | Improvement |
|---|---|---|---|---|
| 2024 | $4,019 | $230,815 | $47,500 | $183,315 |
| 2023 | $3,875 | $180,814 | $26,055 | $154,759 |
| 2022 | $3,875 | $180,814 | $26,055 | $154,759 |
| 2021 | $3,699 | $170,690 | $26,055 | $144,635 |
| 2020 | $3,570 | $163,803 | $26,055 | $137,748 |
| 2019 | $3,483 | $163,803 | $26,055 | $137,748 |
| 2018 | $3,504 | $163,803 | $26,055 | $137,748 |
| 2017 | $3,509 | $163,803 | $26,055 | $137,748 |
| 2016 | $3,258 | $163,803 | $26,055 | $137,748 |
| 2015 | $3,167 | $159,791 | $26,055 | $133,736 |
| 2014 | $3,013 | $149,885 | $26,055 | $123,830 |
| 2012 | -- | $147,457 | $26,055 | $121,402 |
Source: Public Records
Map
Nearby Homes