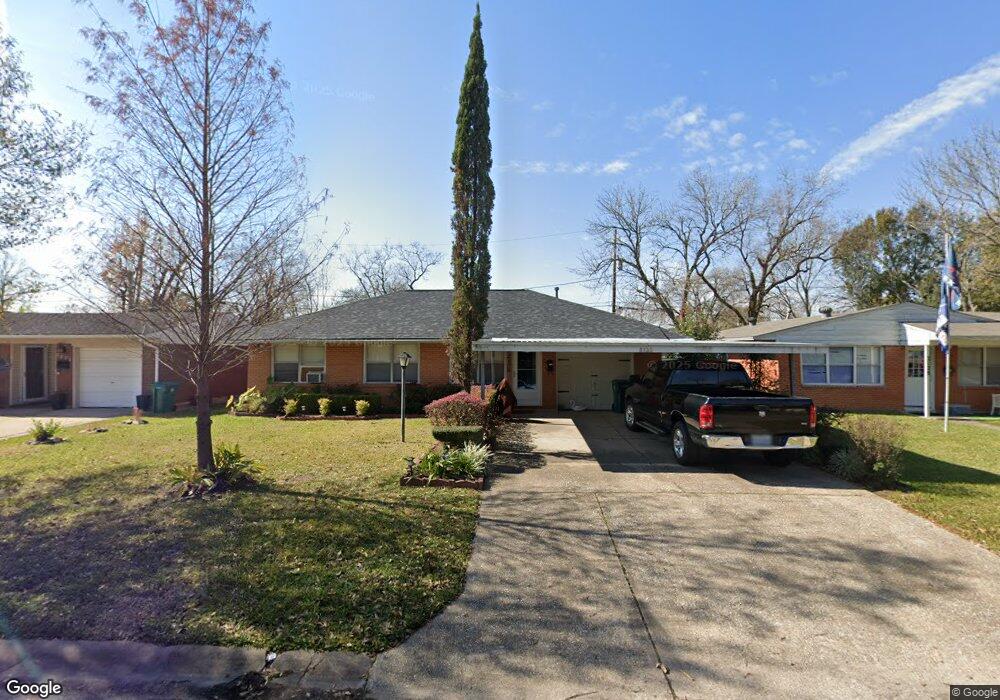
2130 Raspberry Ln Pasadena, TX 77502
Estimated Value: $174,000 - $199,000
3
Beds
2
Baths
1,192
Sq Ft
$160/Sq Ft
Est. Value
About This Home
This home is located at 2130 Raspberry Ln, Pasadena, TX 77502 and is currently estimated at $190,154, approximately $159 per square foot. 2130 Raspberry Ln is a home located in Harris County with nearby schools including Mae Smythe Elementary School, Southmore Intermediate School, and Bobby Shaw Middle School.
Ownership History
Date
Name
Owned For
Owner Type
Purchase Details
Closed on
Aug 2, 2021
Sold by
Faudoa Jaime
Bought by
Faudoa Jaime and Faudoa Lourdes
Current Estimated Value
Home Financials for this Owner
Home Financials are based on the most recent Mortgage that was taken out on this home.
Original Mortgage
$82,225
Outstanding Balance
$74,542
Interest Rate
2.7%
Mortgage Type
New Conventional
Estimated Equity
$115,612
Purchase Details
Closed on
Jun 25, 2007
Sold by
Loehr Harold and Loehr Julia
Bought by
Faudoa Jaime and Faudoa Jaime
Home Financials for this Owner
Home Financials are based on the most recent Mortgage that was taken out on this home.
Original Mortgage
$91,200
Interest Rate
6.19%
Mortgage Type
Purchase Money Mortgage
Purchase Details
Closed on
Nov 12, 2004
Sold by
Parker Shirley Temple and Garcia Eduardo Hernandez
Bought by
Loehr Harold and Loehr Julia
Create a Home Valuation Report for This Property
The Home Valuation Report is an in-depth analysis detailing your home's value as well as a comparison with similar homes in the area
Purchase History
| Date | Buyer | Sale Price | Title Company |
|---|---|---|---|
| Faudoa Jaime | -- | Great American Title | |
| Faudoa Jaime | -- | American Title Company Dp | |
| Loehr Harold | -- | Alamo |
Source: Public Records
Mortgage History
| Date | Status | Borrower | Loan Amount |
|---|---|---|---|
| Open | Faudoa Jaime | $82,225 | |
| Closed | Faudoa Jaime | $91,200 |
Source: Public Records
Tax History
| Year | Tax Paid | Tax Assessment Tax Assessment Total Assessment is a certain percentage of the fair market value that is determined by local assessors to be the total taxable value of land and additions on the property. | Land | Improvement |
|---|---|---|---|---|
| 2025 | $514 | $187,095 | $55,045 | $132,050 |
| 2024 | $514 | $193,967 | $37,981 | $155,986 |
| 2023 | $514 | $193,967 | $37,981 | $155,986 |
| 2022 | $4,323 | $171,268 | $37,981 | $133,287 |
| 2021 | $3,631 | $136,933 | $31,651 | $105,282 |
| 2020 | $3,885 | $142,518 | $31,651 | $110,867 |
| 2019 | $3,746 | $139,921 | $28,899 | $111,022 |
| 2018 | $1,408 | $127,431 | $23,395 | $104,036 |
| 2017 | $2,919 | $125,045 | $23,395 | $101,650 |
| 2016 | $2,653 | $102,911 | $19,266 | $83,645 |
| 2015 | $1,707 | $95,285 | $19,266 | $76,019 |
| 2014 | $1,707 | $82,766 | $19,266 | $63,500 |
Source: Public Records
Map
Nearby Homes
- 2115 Dewberry Ln
- 2102 Dewberry Ln
- 1211 Trimm Ave
- 1904 Edgehill Rd
- 2305 Peach Ln
- 2401 Peach Ln
- 1217 Gary Ave
- 1210 Wilma Lois Ave
- 2055 Pasadena Blvd
- 1205 Hector Ave
- 1218 Gary Ave
- 2120 Chestnut Ln
- 2502 Peach Ln
- 1905 Concord Rd
- 1914 Monroe Dr
- 2516 Blueberry Ln
- 1106 Pauline Ave
- 1308 Fresa Rd
- 1007 Trimm Ave
- 1801 Harding St
- 2202 Raspberry Ln
- 2128 Raspberry Ln
- 2129 Dewberry Ln
- 2126 Raspberry Ln
- 2204 Raspberry Ln
- 2201 Dewberry Ln
- 2127 Dewberry Ln
- 2203 Dewberry Ln
- 2125 Dewberry Ln
- 2129 Raspberry Ln
- 2206 Raspberry Ln
- 2124 Raspberry Ln
- 2127 Raspberry Ln
- 2201 Raspberry Ln
- 2125 Raspberry Ln
- 2205 Dewberry Ln
- 2203 Raspberry Ln
- 2123 Dewberry Ln
- 2208 Raspberry Ln
- 2122 Raspberry Ln
Your Personal Tour Guide
Ask me questions while you tour the home.