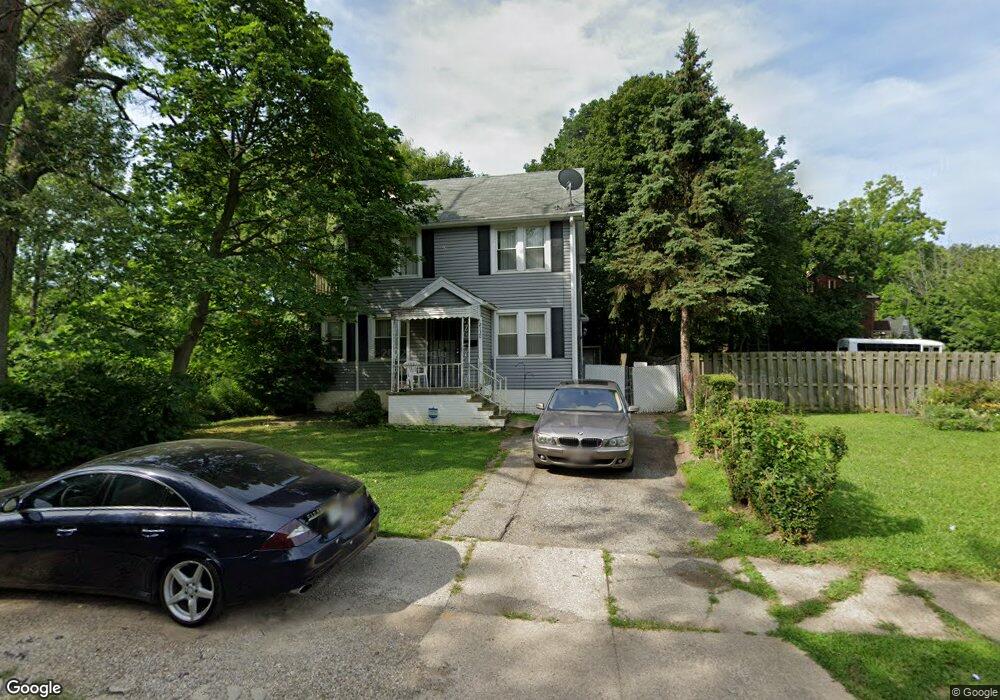
2130 Westburn Ave Cleveland, OH 44112
Estimated Value: $76,000 - $92,000
4
Beds
2
Baths
1,343
Sq Ft
$63/Sq Ft
Est. Value
About This Home
This home is located at 2130 Westburn Ave, Cleveland, OH 44112 and is currently estimated at $84,810, approximately $63 per square foot. 2130 Westburn Ave is a home located in Cuyahoga County with nearby schools including Shaw High School, Apex Academy, and East Academy.
Ownership History
Date
Name
Owned For
Owner Type
Purchase Details
Closed on
Oct 16, 2008
Sold by
Econohomes Llc
Bought by
Karim Deandre M
Current Estimated Value
Purchase Details
Closed on
Oct 23, 2007
Sold by
Blue Spruce Entities Llc
Bought by
Econohomes Llc
Purchase Details
Closed on
Oct 22, 2007
Sold by
Nationstar Mortgage Llc
Bought by
Blue Spruce Entities Llc
Purchase Details
Closed on
Nov 28, 2005
Sold by
Jamison Brenda F and Vanden Ruth
Bought by
Centex Home Equity Co Llc
Purchase Details
Closed on
Dec 7, 1992
Sold by
Rysar Prop Inc An
Bought by
Vanden Ruth
Purchase Details
Closed on
Jun 19, 1992
Bought by
Rysar Prop Inc An
Purchase Details
Closed on
Jan 22, 1992
Sold by
Grier Andrew D
Bought by
Bank One Of Columbus, Na,
Purchase Details
Closed on
Jan 25, 1985
Sold by
Hickman Marie
Bought by
Grier Andrew D
Purchase Details
Closed on
Jan 1, 1975
Bought by
Hickman Marie
Create a Home Valuation Report for This Property
The Home Valuation Report is an in-depth analysis detailing your home's value as well as a comparison with similar homes in the area
Home Values in the Area
Average Home Value in this Area
Purchase History
| Date | Buyer | Sale Price | Title Company |
|---|---|---|---|
| Karim Deandre M | $1,000 | None Available | |
| Econohomes Llc | $1,500 | None Available | |
| Blue Spruce Entities Llc | $1,000 | None Available | |
| Centex Home Equity Co Llc | $50,000 | Attorney | |
| Vanden Ruth | $56,900 | -- | |
| Rysar Prop Inc An | $13,500 | -- | |
| Bank One Of Columbus, Na, | $26,000 | -- | |
| Grier Andrew D | $44,000 | -- | |
| Hickman Marie | -- | -- |
Source: Public Records
Tax History Compared to Growth
Tax History
| Year | Tax Paid | Tax Assessment Tax Assessment Total Assessment is a certain percentage of the fair market value that is determined by local assessors to be the total taxable value of land and additions on the property. | Land | Improvement |
|---|---|---|---|---|
| 2024 | $1,516 | $23,380 | $5,285 | $18,095 |
| 2023 | $1,049 | $10,610 | $2,590 | $8,020 |
| 2022 | $1,046 | $10,610 | $2,590 | $8,020 |
| 2021 | $1,037 | $10,610 | $2,590 | $8,020 |
| 2020 | $1,133 | $10,850 | $2,660 | $8,190 |
| 2019 | $1,181 | $31,000 | $7,600 | $23,400 |
| 2018 | $1,398 | $10,850 | $2,660 | $8,190 |
| 2017 | $1,634 | $16,980 | $3,540 | $13,440 |
| 2016 | $1,622 | $16,980 | $3,540 | $13,440 |
| 2015 | $3,287 | $16,980 | $3,540 | $13,440 |
| 2014 | $3,287 | $19,960 | $4,170 | $15,790 |
Source: Public Records
Map
Nearby Homes
- 2121 Alton Rd
- 2116 Reyburn Rd
- 2133 Reyburn Rd
- 1875 Lampson Rd
- 3595 Runnymede Blvd
- 3609 Langton Rd
- 3511 Randolph Rd
- 16208 Greyton Rd
- 1816 Lampson Rd
- 3547 Randolph Rd
- 825 Helmsdale Rd
- 3598 Atherstone Rd
- 833 Nela View Rd
- 3655 Langton Rd
- 839 Nela View Rd
- 841 Helmsdale Rd
- 1767 Algonac Rd Unit 2
- 1762 Alcoy Rd
- 1758 Algonac Rd
- 861 Caledonia Ave
- 2134 Westburn Ave
- 2126 Westburn Ave
- 2122 Alton Rd
- 2118 Alton Rd
- 2146 Westburn Ave
- 2114 Westburn Ave
- 2129 Westburn Ave
- 2137 Westburn Ave
- 2125 Westburn Ave
- 2121 Westburn Ave
- 2108 Westburn Ave
- 2114 Alton Rd
- 2117 Westburn Ave
- 2145 Westburn Ave
- 2113 Westburn Ave
- 2104 Westburn Ave
- 2109 Alton Rd
- 2109 Westburn Ave
- 2100 Westburn Ave
- 2128 Reyburn Rd