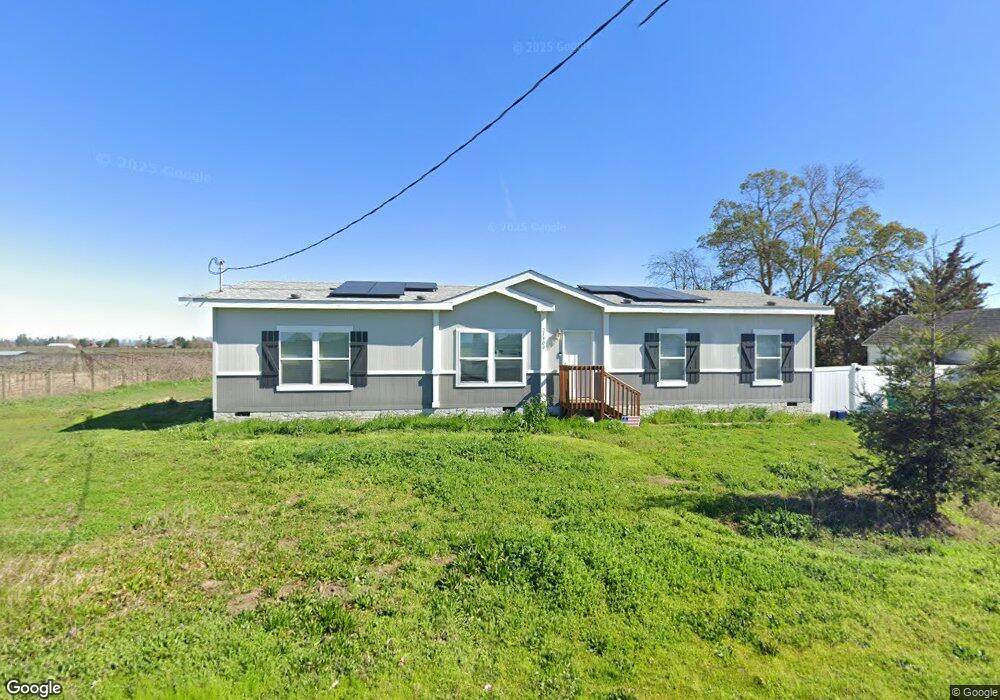
21300 N Mann Rd Acampo, CA 95220
Estimated Value: $692,319 - $869,000
3
Beds
2
Baths
1,596
Sq Ft
$479/Sq Ft
Est. Value
About This Home
This home is located at 21300 N Mann Rd, Acampo, CA 95220 and is currently estimated at $765,080, approximately $479 per square foot. 21300 N Mann Rd is a home located in San Joaquin County with nearby schools including Houston School, Victor Elementary School, and Lodi High School.
Ownership History
Date
Name
Owned For
Owner Type
Purchase Details
Closed on
Jun 18, 2019
Sold by
Prettyman Charlene D and Bronner William W
Bought by
Richards Sandra M
Current Estimated Value
Home Financials for this Owner
Home Financials are based on the most recent Mortgage that was taken out on this home.
Original Mortgage
$220,500
Outstanding Balance
$194,970
Interest Rate
4%
Mortgage Type
Construction
Estimated Equity
$570,110
Purchase Details
Closed on
Oct 26, 2017
Sold by
Prettyman Charlene D
Bought by
Prettyman Charlene D and Bronner William W
Purchase Details
Closed on
Oct 29, 2001
Sold by
Bronner Elouise and Prettyman Charlene
Bought by
Bronner Elouise and Prettyman Charlene
Home Financials for this Owner
Home Financials are based on the most recent Mortgage that was taken out on this home.
Original Mortgage
$50,000
Interest Rate
7.01%
Mortgage Type
Credit Line Revolving
Purchase Details
Closed on
Mar 19, 1999
Sold by
Bronner Elouise L
Bought by
Bronner Elouise Litchfield and Prettyman Charlene
Create a Home Valuation Report for This Property
The Home Valuation Report is an in-depth analysis detailing your home's value as well as a comparison with similar homes in the area
Purchase History
| Date | Buyer | Sale Price | Title Company |
|---|---|---|---|
| Richards Sandra M | $220,500 | Placer Title Company Auburn | |
| Prettyman Charlene D | -- | None Available | |
| Bronner Elouise | -- | Chicago Title Co | |
| Bronner Elouise Litchfield | -- | -- |
Source: Public Records
Mortgage History
| Date | Status | Borrower | Loan Amount |
|---|---|---|---|
| Open | Richards Sandra M | $220,500 | |
| Previous Owner | Bronner Elouise | $50,000 |
Source: Public Records
Tax History
| Year | Tax Paid | Tax Assessment Tax Assessment Total Assessment is a certain percentage of the fair market value that is determined by local assessors to be the total taxable value of land and additions on the property. | Land | Improvement |
|---|---|---|---|---|
| 2025 | $4,363 | $400,261 | $241,146 | $159,115 |
| 2024 | $4,245 | $392,414 | $236,418 | $155,996 |
| 2023 | $4,196 | $384,721 | $231,783 | $152,938 |
| 2022 | $4,103 | $377,179 | $227,239 | $149,940 |
| 2021 | $2,535 | $222,784 | $222,784 | $0 |
| 2020 | $2,462 | $220,500 | $220,500 | $0 |
| 2019 | $1,439 | $36,981 | $20,545 | $16,436 |
| 2018 | $840 | $36,257 | $20,143 | $16,114 |
| 2017 | $1,476 | $129,870 | $108,225 | $21,645 |
| 2016 | $336 | $34,852 | $19,362 | $15,490 |
| 2014 | $321 | $33,656 | $18,698 | $14,958 |
Source: Public Records
Map
Nearby Homes
- 21428 N Dutchess Ln
- 21324 N Dutchess Ln
- 21376 N Dutchess Ln
- 21863 N Bruella Rd
- 8275 E Orchard Rd Unit E
- 11153 E Peltier Rd
- 22135 Bruella Rd
- 11501 E Jahant Rd
- 6233 E Woodbridge Rd
- 21167 N Tretheway Rd
- 5712 E Jahant Rd
- 20388 N State Route 99 E Fron
- 19690 N Highway 99 Unit 26
- 19690 N Highway 99 Unit 7
- 19690 N Highway 99 Unit 8
- 19690 N Highway 99 Unit 18
- 19690 N Highway 99 Unit 162
- 5420 E Jahant Rd
- 19690 California 99 Unit 110
- 19690 California 99 Unit 121
- 21262 N Mann Rd
- 21288 N Mann Rd
- 21301 N Mann Rd
- 21380 N Mann Rd
- 21379 N Mann Rd
- 21466 N Mann Rd
- 21474 N Mann Rd
- 21513 N Mann Rd
- 21634 N Mann Rd
- 21495 N Mann Rd
- 18767 N Highway 99
- 18915 N Highway 99
- 8697 E Acampo Rd
- 8115 E Acampo Rd
- 8585 E Acampo Rd
- 8491 E Acampo Rd
- 8695 E Acampo Rd
- 8575 E Acampo Rd
- 8530 E Acampo Rd
- 8534 E Acampo Rd
Your Personal Tour Guide
Ask me questions while you tour the home.