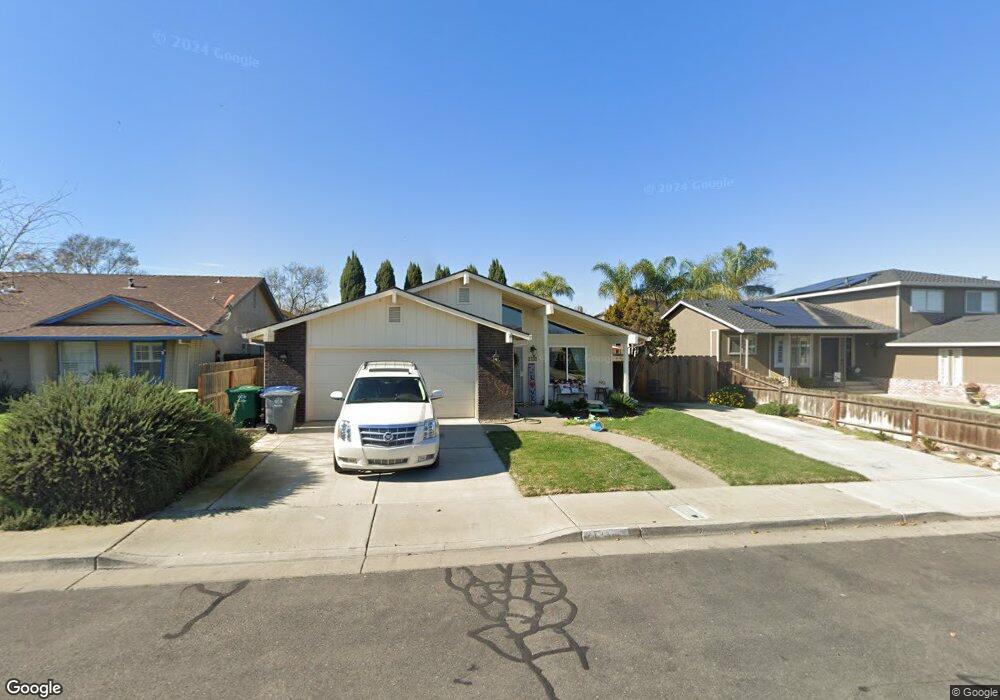
2131 Arroyo Ct Los Banos, CA 93635
Estimated Value: $415,000 - $462,000
3
Beds
2
Baths
1,510
Sq Ft
$296/Sq Ft
Est. Value
About This Home
This home is located at 2131 Arroyo Ct, Los Banos, CA 93635 and is currently estimated at $446,954, approximately $295 per square foot. 2131 Arroyo Ct is a home located in Merced County with nearby schools including Los Banos Elementary School, Creekside Junior High School, and Los Banos High School.
Ownership History
Date
Name
Owned For
Owner Type
Purchase Details
Closed on
Apr 22, 2020
Sold by
Hostetler Rory
Bought by
Hostetler Rory
Current Estimated Value
Purchase Details
Closed on
Feb 21, 2020
Sold by
Rider Suzanne and Hostetler Rory
Bought by
Hostetler Rory
Purchase Details
Closed on
Jun 20, 2003
Sold by
Hostetler Edward and Hostetler Merry
Bought by
Hostetler Edward W and Hostetler Merry Belle
Purchase Details
Closed on
Apr 14, 2003
Sold by
Hoagland Harold V and Hoagland Caroline N
Bought by
Hostetler Edward and Hostetler Merry
Home Financials for this Owner
Home Financials are based on the most recent Mortgage that was taken out on this home.
Original Mortgage
$149,800
Interest Rate
2.45%
Mortgage Type
Negative Amortization
Purchase Details
Closed on
Sep 22, 2000
Sold by
Hoagland Harold V and Hoagland Caroline N
Bought by
Hoagland Harold V and Hoagland Caroline N
Create a Home Valuation Report for This Property
The Home Valuation Report is an in-depth analysis detailing your home's value as well as a comparison with similar homes in the area
Home Values in the Area
Average Home Value in this Area
Purchase History
| Date | Buyer | Sale Price | Title Company |
|---|---|---|---|
| Hostetler Rory | -- | None Available | |
| Hostetler Rory | -- | None Available | |
| Hostetler Rory | -- | None Available | |
| Rider Suzanne | -- | None Available | |
| Hostetler Edward W | -- | Transcounty Title Company | |
| Hostetler Edward | $214,000 | Chicago Title Company | |
| Hoagland Harold V | -- | -- |
Source: Public Records
Mortgage History
| Date | Status | Borrower | Loan Amount |
|---|---|---|---|
| Previous Owner | Hostetler Edward | $149,800 |
Source: Public Records
Tax History Compared to Growth
Tax History
| Year | Tax Paid | Tax Assessment Tax Assessment Total Assessment is a certain percentage of the fair market value that is determined by local assessors to be the total taxable value of land and additions on the property. | Land | Improvement |
|---|---|---|---|---|
| 2025 | $3,705 | $309,924 | $57,922 | $252,002 |
| 2024 | $3,705 | $303,848 | $56,787 | $247,061 |
| 2023 | $3,490 | $297,891 | $55,674 | $242,217 |
| 2022 | $3,420 | $292,051 | $54,583 | $237,468 |
| 2021 | $3,369 | $286,325 | $53,513 | $232,812 |
| 2020 | $3,325 | $283,390 | $52,965 | $230,425 |
| 2019 | $3,264 | $277,834 | $51,927 | $225,907 |
| 2018 | $3,168 | $272,387 | $50,909 | $221,478 |
| 2017 | $3,129 | $267,047 | $49,911 | $217,136 |
| 2016 | $2,949 | $243,000 | $55,000 | $188,000 |
| 2015 | $2,854 | $236,000 | $60,000 | $176,000 |
| 2014 | $2,385 | $196,000 | $30,000 | $166,000 |
Source: Public Records
Map
Nearby Homes
- 2127 Arroyo Ct
- 2135 Arroyo Ct
- 2130 Black Hills Ave
- 2134 Black Hills Ave
- 2126 Black Hills Ave
- 2123 Arroyo Ct
- 2139 Arroyo Ct
- 2122 Black Hills Ave
- 2132 Arroyo Ct
- 2138 Black Hills Ave
- 2136 Arroyo Ct
- 2128 Arroyo Ct
- 2140 Arroyo Ct
- 2143 Arroyo Ct
- 2142 Black Hills Ave
- 2144 Arroyo Ct
- 2133 Mckinley Ct
- 725 Mckinley St
- 2129 Mckinley Ct
- 2147 Arroyo Ct