
Landlord's Agent in 2018
Nicole Schroeder
Midtown Realty Group LLC
(312) 560-8546
9 Total Sales


Estimated Value: $425,003 - $475,000
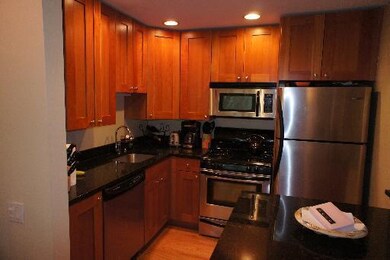
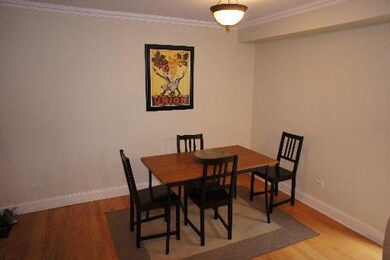
Location, location, location! Great DePaul area top-floor condo with every upgrade- Hrdwd floors in lr/ dr/kitchen, granite counter tops in kitchen/bathroom, stone in shower with 2 shower heads/frameles door, ss apps, w/d in unit, crown molding, freshly painted. Unit has a balcony that over looks Oz Park. All this and prime parking space included in price! Best Oz Park Gardens has to offer
Last Agent to Rent the Property
Midtown Realty Group LLC License #471006987 Listed on: 09/07/2018
Last Renter's Agent
Midtown Realty Group LLC License #471006987 Listed on: 09/07/2018
| Date | Buyer | Sale Price | Title Company |
|---|---|---|---|
| Schneider Joel | -- | Old Republic National Title | |
| Schneider Joel | $340,000 | Ticor Title Insurance Compan |
| Date | Status | Borrower | Loan Amount |
|---|---|---|---|
| Open | Schneider Joel | $144,500 | |
| Open | Schneider Joel | $417,000 | |
| Closed | Schneider Joel | $189,500 |
| Date | Event | Price | Change | Sq Ft Price |
|---|---|---|---|---|
| 10/05/2018 10/05/18 | Rented | $2,200 | 0.0% | -- |
| 09/28/2018 09/28/18 | Under Contract | -- | -- | -- |
| 09/21/2018 09/21/18 | Price Changed | $2,200 | -12.0% | -- |
| 09/07/2018 09/07/18 | For Rent | $2,500 | +4.2% | -- |
| 09/08/2016 09/08/16 | Rented | $2,400 | -4.0% | -- |
| 08/08/2016 08/08/16 | For Rent | $2,500 | -- | -- |
| Year | Tax Paid | Tax Assessment Tax Assessment Total Assessment is a certain percentage of the fair market value that is determined by local assessors to be the total taxable value of land and additions on the property. | Land | Improvement |
|---|---|---|---|---|
| 2024 | $6,912 | $36,059 | $3,260 | $32,799 |
| 2023 | $6,738 | $32,760 | $6,271 | $26,489 |
| 2022 | $6,738 | $32,760 | $6,271 | $26,489 |
| 2021 | $6,588 | $32,759 | $6,271 | $26,488 |
| 2020 | $5,921 | $26,579 | $5,518 | $21,061 |
| 2019 | $5,800 | $28,866 | $5,518 | $23,348 |
| 2018 | $5,702 | $28,866 | $5,518 | $23,348 |
| 2017 | $5,320 | $24,714 | $4,515 | $20,199 |
| 2016 | $4,950 | $24,714 | $4,515 | $20,199 |
| 2015 | $4,048 | $24,714 | $4,515 | $20,199 |
| 2014 | $4,143 | $24,899 | $3,386 | $21,513 |
| 2013 | $4,050 | $24,899 | $3,386 | $21,513 |
Landlord's Agent in 2018
Nicole Schroeder
Midtown Realty Group LLC
(312) 560-8546
9 Total Sales
A
Buyer's Agent in 2016
Alex Margulis
Kale Realty
(312) 939-5253
1 Total Sale
Source: Midwest Real Estate Data (MRED)
MLS Number: MRD10075880
APN: 14-33-121-080-1041
Disclaimer: Certain information contained herein is derived from information provided by parties other than Homes.com. All information provided is deemed reliable, but is not guaranteed to be accurate and should be independently verified.
![]() Based on information submitted to the MLS GRID. All data is obtained from various sources and may not have been verified by broker or MLS GRID. Supplied Open House Information is subject to change without notice. All information should be independently reviewed and verified for accuracy. Properties may or may not be listed by the office/agent presenting the information. Some IDX listings have been excluded from this website.
Based on information submitted to the MLS GRID. All data is obtained from various sources and may not have been verified by broker or MLS GRID. Supplied Open House Information is subject to change without notice. All information should be independently reviewed and verified for accuracy. Properties may or may not be listed by the office/agent presenting the information. Some IDX listings have been excluded from this website.
The Digital Millennium Copyright Act of 1998, 17 U.S.C. § 512 (the “DMCA”) provides recourse for copyright owners who believe that material appearing on the Internet infringes their rights under U.S. copyright law. If you believe in good faith that any content or material made available in connection with our website or services infringes your copyright, you (or your agent) may send us a notice requesting that the content or material be removed, or access to it blocked.
Notices must be sent in writing by email to DMCAnotice@MLSGrid.com.
The DMCA requires that your notice of alleged copyright infringement include the following information:
(1) description of the copyrighted work that is the subject of claimed infringement;
(2) description of the alleged infringing content and information sufficient to permit us to locate the content;
(3) contact information for you, including your address, telephone number and email address;
(4) a statement by you that you have a good faith belief that the content in the manner complained of is not authorized by the copyright owner, or its agent, or by the operation of any law;
(5) a statement by you, signed under penalty of perjury, that the information in the notification is accurate and that you have the authority to enforce the copyrights that are claimed to be infringed; and
(6) a physical or electronic signature of the copyright owner or a person authorized to act on the copyright owner’s behalf. Failure to include all of the above information may result in the delay of the processing of your complaint.