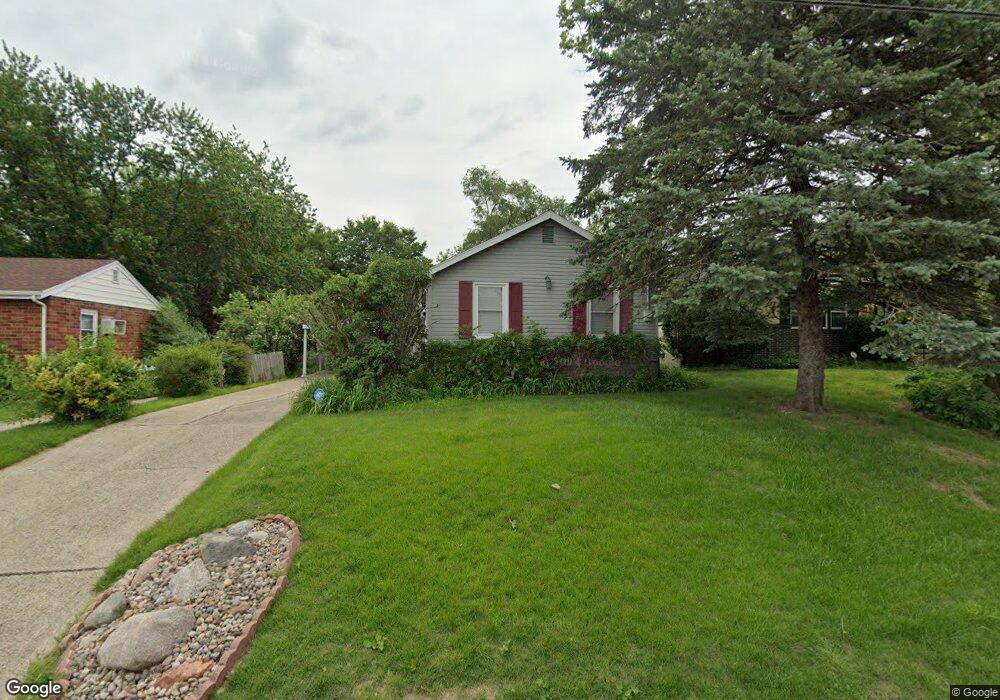
2131 Searle St Des Moines, IA 50317
Fairmont Park NeighborhoodEstimated Value: $137,000 - $161,000
2
Beds
1
Bath
1,000
Sq Ft
$145/Sq Ft
Est. Value
About This Home
This home is located at 2131 Searle St, Des Moines, IA 50317 and is currently estimated at $144,575, approximately $144 per square foot. 2131 Searle St is a home located in Polk County with nearby schools including Phillips Elementary, Goodrell Middle School, and North High School.
Ownership History
Date
Name
Owned For
Owner Type
Purchase Details
Closed on
Jun 12, 2024
Sold by
Simmons Ronald E and Simmons Tammy Lee
Bought by
Home Group Solution Llc
Current Estimated Value
Home Financials for this Owner
Home Financials are based on the most recent Mortgage that was taken out on this home.
Original Mortgage
$112,000
Outstanding Balance
$110,491
Interest Rate
7.09%
Mortgage Type
New Conventional
Estimated Equity
$34,084
Purchase Details
Closed on
Mar 13, 2016
Sold by
Simmons Ronald and Treanor Terry A
Bought by
Simmons Lupe M
Purchase Details
Closed on
Dec 13, 2012
Sold by
Simmons Rosecoe E and Simmons Lupe M
Bought by
Simmons Rosecoe E and Simmons Lupe M
Create a Home Valuation Report for This Property
The Home Valuation Report is an in-depth analysis detailing your home's value as well as a comparison with similar homes in the area
Home Values in the Area
Average Home Value in this Area
Purchase History
| Date | Buyer | Sale Price | Title Company |
|---|---|---|---|
| Home Group Solution Llc | -- | None Listed On Document | |
| Simmons Lupe M | -- | None Available | |
| Simmons Rosecoe E | -- | None Available |
Source: Public Records
Mortgage History
| Date | Status | Borrower | Loan Amount |
|---|---|---|---|
| Open | Home Group Solution Llc | $112,000 |
Source: Public Records
Tax History
| Year | Tax Paid | Tax Assessment Tax Assessment Total Assessment is a certain percentage of the fair market value that is determined by local assessors to be the total taxable value of land and additions on the property. | Land | Improvement |
|---|---|---|---|---|
| 2025 | $1,608 | $112,600 | $26,100 | $86,500 |
| 2024 | $1,608 | $99,200 | $22,600 | $76,600 |
| 2023 | $1,596 | $99,200 | $22,600 | $76,600 |
| 2022 | $1,582 | $76,600 | $17,900 | $58,700 |
| 2021 | $1,480 | $76,600 | $17,900 | $58,700 |
| 2020 | $1,532 | $67,900 | $15,800 | $52,100 |
| 2019 | $1,308 | $67,900 | $15,800 | $52,100 |
| 2018 | $1,290 | $57,200 | $13,100 | $44,100 |
| 2017 | $1,290 | $57,200 | $13,100 | $44,100 |
| 2016 | $1,252 | $56,200 | $12,600 | $43,600 |
| 2015 | $1,252 | $56,200 | $12,600 | $43,600 |
| 2014 | $1,226 | $56,800 | $12,500 | $44,300 |
Source: Public Records
Map
Nearby Homes
- 2324 E 23rd St
- 2208 Tichenor St
- 2113 E 21st St
- 1901 E 23rd St
- 2503 E 24th St
- 2539 E 23rd St
- 1821 E 25th St
- 1614 Searle St
- 2114 Boyd St
- 1517 Delaware Ave
- 2654 Wisconsin Ave
- 2670 Wisconsin Ave
- 1529 E 19th St
- 1410 E 23rd St
- 2612 Grandview Ave
- 2633 Grandview Ave
- 1527 de Wolf St
- 2555 Hull Ave
- 1415 Delaware Ave
- 1411 Delaware Ave
Your Personal Tour Guide
Ask me questions while you tour the home.