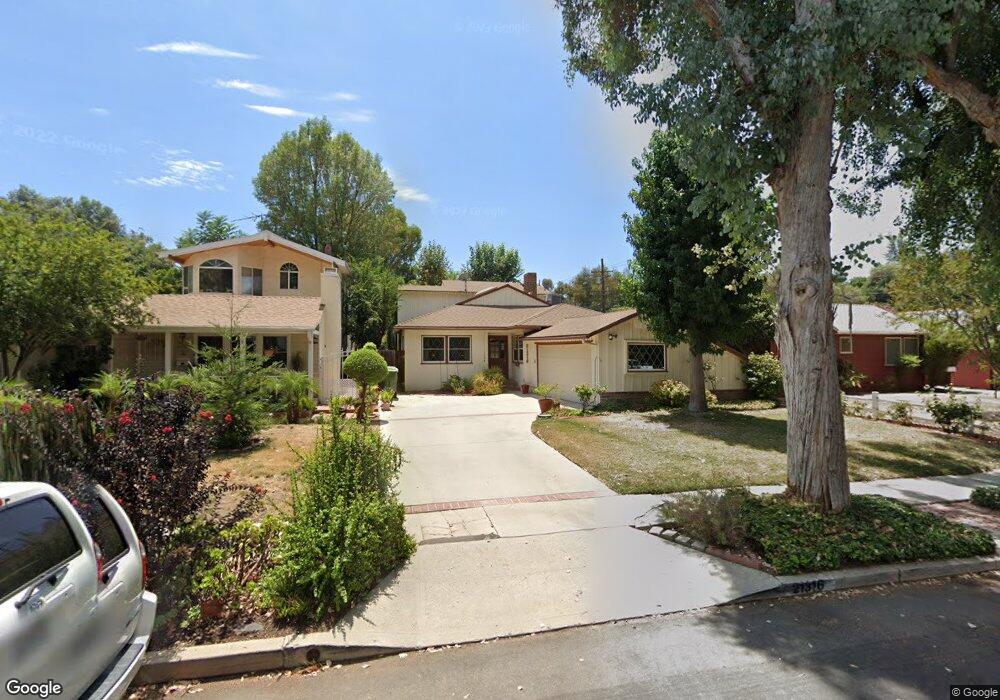
21316 De la Osa St Woodland Hills, CA 91364
Estimated Value: $1,196,407 - $1,341,000
4
Beds
3
Baths
2,192
Sq Ft
$582/Sq Ft
Est. Value
About This Home
This home is located at 21316 De la Osa St, Woodland Hills, CA 91364 and is currently estimated at $1,276,102, approximately $582 per square foot. 21316 De la Osa St is a home located in Los Angeles County with nearby schools including Woodland Hills Academy, Serrania Charter For Enriched Studies, and Woodland Hills Elementary Charter For Enriched Studies.
Ownership History
Date
Name
Owned For
Owner Type
Purchase Details
Closed on
May 18, 2018
Sold by
Miller Robert A
Bought by
Miller Robert A
Current Estimated Value
Home Financials for this Owner
Home Financials are based on the most recent Mortgage that was taken out on this home.
Original Mortgage
$330,000
Interest Rate
4.4%
Mortgage Type
New Conventional
Purchase Details
Closed on
Feb 23, 2018
Sold by
Miller Laurie Anne
Bought by
Miller Robert A
Purchase Details
Closed on
Mar 9, 2004
Sold by
Miller Robert Aubry
Bought by
Miller Robert Aubry and Miller Laurie Anne
Home Financials for this Owner
Home Financials are based on the most recent Mortgage that was taken out on this home.
Original Mortgage
$94,100
Interest Rate
5.69%
Mortgage Type
New Conventional
Create a Home Valuation Report for This Property
The Home Valuation Report is an in-depth analysis detailing your home's value as well as a comparison with similar homes in the area
Home Values in the Area
Average Home Value in this Area
Purchase History
| Date | Buyer | Sale Price | Title Company |
|---|---|---|---|
| Miller Robert A | -- | California Members Title Com | |
| Miller Robert A | -- | None Available | |
| Miller Robert Aubry | -- | Stewart Title Of Ca Inc |
Source: Public Records
Mortgage History
| Date | Status | Borrower | Loan Amount |
|---|---|---|---|
| Closed | Miller Robert A | $330,000 | |
| Closed | Miller Robert Aubry | $94,100 |
Source: Public Records
Tax History Compared to Growth
Tax History
| Year | Tax Paid | Tax Assessment Tax Assessment Total Assessment is a certain percentage of the fair market value that is determined by local assessors to be the total taxable value of land and additions on the property. | Land | Improvement |
|---|---|---|---|---|
| 2025 | $2,758 | $211,515 | $41,887 | $169,628 |
| 2024 | $2,758 | $207,368 | $41,066 | $166,302 |
| 2023 | $2,708 | $203,303 | $40,261 | $163,042 |
| 2022 | $2,608 | $199,318 | $39,472 | $159,846 |
| 2021 | $2,564 | $195,411 | $38,699 | $156,712 |
| 2019 | $2,490 | $189,617 | $37,552 | $152,065 |
| 2018 | $2,427 | $185,900 | $36,816 | $149,084 |
| 2016 | $2,282 | $178,684 | $35,388 | $143,296 |
| 2015 | $2,250 | $176,001 | $34,857 | $141,144 |
| 2014 | $2,265 | $172,555 | $34,175 | $138,380 |
Source: Public Records
Map
Nearby Homes
- 4256 Canoga Ave
- 21115 Lopez St
- 4938 Medina Rd
- 5143 Escobedo Dr
- 5052 Medina Rd
- 5105 Escobedo Dr
- 5119 Escobedo Dr
- 0 Lopez St
- 5130 Medina Rd
- 5102 Medina Rd
- 5134 Medina Rd
- 5102 Escobedo Dr
- 4922 Escobedo Dr
- 5108 Escobedo Dr
- 4831 Canoga Ave
- 5223 Alhama Dr
- 21651 Yucatan Ave
- 5040 Marmol Dr
- 5015 Calatrana Dr
- 5005 Catalon Ave
- 21322 De la Osa St
- 21312 De la Osa St
- 21306 De la Osa St
- 5024 Canoga Ave
- 5018 Canoga Ave
- 21300 De la Osa St
- 21317 San Miguel St
- 5030 Canoga Ave
- 21313 San Miguel St
- 21323 San Miguel St
- 21307 San Miguel St
- 21317 De la Osa St
- 5010 Canoga Ave
- 21313 De la Osa St
- 21323 De la Osa St
- 21236 De la Osa St
- 21303 San Miguel St
- 21307 De la Osa St
- 21327 De la Osa St
- 21303 De la Osa St