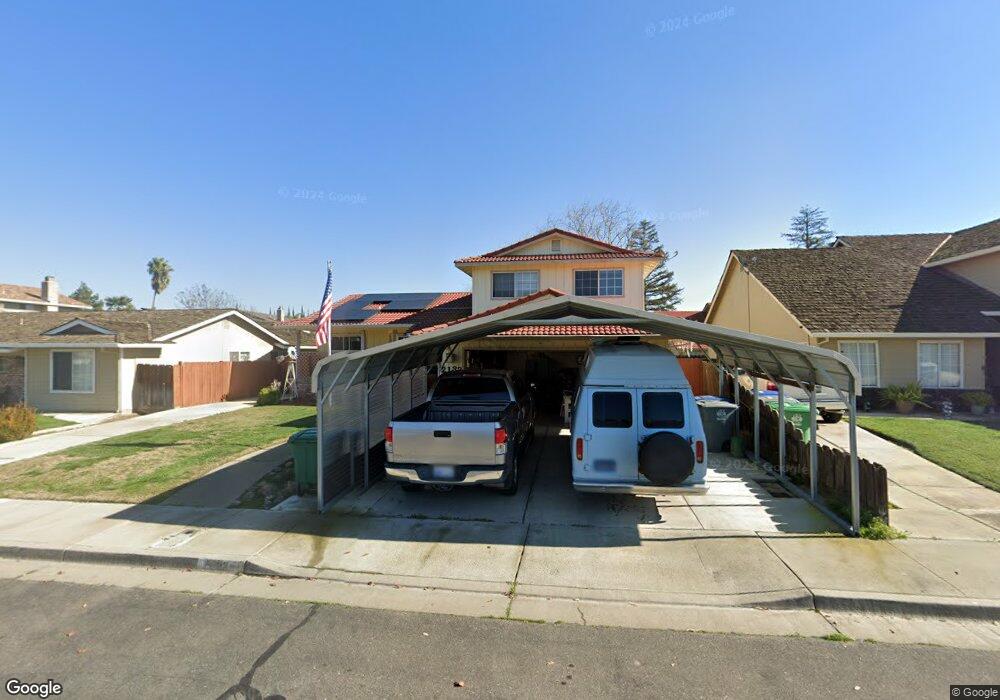
2132 Arroyo Ct Los Banos, CA 93635
Estimated Value: $492,000 - $530,000
4
Beds
2
Baths
2,029
Sq Ft
$249/Sq Ft
Est. Value
About This Home
This home is located at 2132 Arroyo Ct, Los Banos, CA 93635 and is currently estimated at $505,063, approximately $248 per square foot. 2132 Arroyo Ct is a home located in Merced County with nearby schools including Los Banos Elementary School, Creekside Junior High School, and Los Banos High School.
Ownership History
Date
Name
Owned For
Owner Type
Purchase Details
Closed on
May 8, 2008
Sold by
Us Bank Na
Bought by
Baldwin Ronald G and Baldwin Darla A
Current Estimated Value
Home Financials for this Owner
Home Financials are based on the most recent Mortgage that was taken out on this home.
Original Mortgage
$157,250
Outstanding Balance
$99,586
Interest Rate
5.88%
Mortgage Type
Purchase Money Mortgage
Estimated Equity
$405,477
Purchase Details
Closed on
Jan 24, 2008
Sold by
Sarinana Joshua
Bought by
Us Bank Na
Purchase Details
Closed on
Jan 30, 2004
Sold by
Raymus Development & Sales Inc
Bought by
Sarinana Joshua
Home Financials for this Owner
Home Financials are based on the most recent Mortgage that was taken out on this home.
Original Mortgage
$262,800
Interest Rate
7.25%
Mortgage Type
Purchase Money Mortgage
Create a Home Valuation Report for This Property
The Home Valuation Report is an in-depth analysis detailing your home's value as well as a comparison with similar homes in the area
Home Values in the Area
Average Home Value in this Area
Purchase History
| Date | Buyer | Sale Price | Title Company |
|---|---|---|---|
| Baldwin Ronald G | $185,000 | First American Title Company | |
| Us Bank Na | $278,550 | First American Title Company | |
| Sarinana Joshua | $292,000 | Chicago Title Company |
Source: Public Records
Mortgage History
| Date | Status | Borrower | Loan Amount |
|---|---|---|---|
| Open | Baldwin Ronald G | $157,250 | |
| Previous Owner | Sarinana Joshua | $262,800 |
Source: Public Records
Tax History Compared to Growth
Tax History
| Year | Tax Paid | Tax Assessment Tax Assessment Total Assessment is a certain percentage of the fair market value that is determined by local assessors to be the total taxable value of land and additions on the property. | Land | Improvement |
|---|---|---|---|---|
| 2025 | $3,731 | $319,393 | $105,073 | $214,320 |
| 2024 | $3,731 | $313,131 | $103,013 | $210,118 |
| 2023 | $3,512 | $306,993 | $100,994 | $205,999 |
| 2022 | $3,441 | $300,974 | $99,014 | $201,960 |
| 2021 | $3,388 | $295,073 | $97,073 | $198,000 |
| 2020 | $3,344 | $292,048 | $96,078 | $195,970 |
| 2019 | $3,281 | $286,323 | $94,195 | $192,128 |
| 2018 | $3,182 | $280,710 | $92,349 | $188,361 |
| 2017 | $3,142 | $275,207 | $90,539 | $184,668 |
| 2016 | $3,174 | $269,812 | $88,764 | $181,048 |
| 2015 | $3,111 | $265,760 | $87,431 | $178,329 |
| 2014 | $3,030 | $260,555 | $85,719 | $174,836 |
Source: Public Records
Map
Nearby Homes
- 2128 Arroyo Ct
- 2136 Arroyo Ct
- 2133 Mckinley Ct
- 2129 Mckinley Ct
- 2140 Arroyo Ct
- 2137 Mckinley Ct
- 2125 Mckinley Ct
- 2131 Arroyo Ct
- 2127 Arroyo Ct
- 2141 Mckinley Ct
- 2135 Arroyo Ct
- 2123 Arroyo Ct
- 2144 Arroyo Ct
- 2139 Arroyo Ct
- 2145 Mckinley Ct
- 2130 Black Hills Ave
- 2126 Black Hills Ave
- 2134 Black Hills Ave
- 802 Mckinley St
- 2148 Arroyo Ct