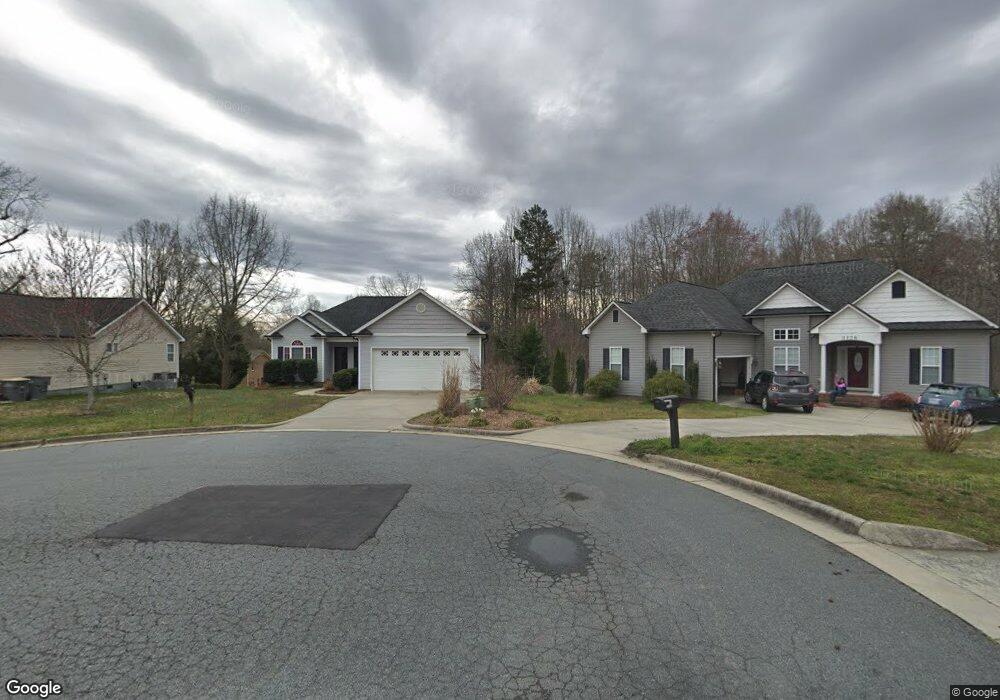
2132 Charles Towne Ct Kannapolis, NC 28083
Estimated Value: $311,585 - $320,000
3
Beds
2
Baths
1,374
Sq Ft
$230/Sq Ft
Est. Value
About This Home
This home is located at 2132 Charles Towne Ct, Kannapolis, NC 28083 and is currently estimated at $315,896, approximately $229 per square foot. 2132 Charles Towne Ct is a home located in Rowan County with nearby schools including Jackson Park Elementary School, Kannapolis Middle, and A.L. Brown High School.
Ownership History
Date
Name
Owned For
Owner Type
Purchase Details
Closed on
May 29, 2015
Sold by
Chambers Willie and Chambers Kimberly
Bought by
Carmendy David and Moran Caitlin
Current Estimated Value
Home Financials for this Owner
Home Financials are based on the most recent Mortgage that was taken out on this home.
Original Mortgage
$138,710
Outstanding Balance
$107,588
Interest Rate
3.79%
Mortgage Type
New Conventional
Estimated Equity
$208,308
Purchase Details
Closed on
May 11, 2009
Sold by
Quality Home Builders Of The Carolinas I
Bought by
Chambers Willie and Chambers Kimberly
Home Financials for this Owner
Home Financials are based on the most recent Mortgage that was taken out on this home.
Original Mortgage
$127,500
Interest Rate
4.86%
Mortgage Type
Purchase Money Mortgage
Purchase Details
Closed on
Dec 28, 2006
Sold by
Bridlewood Properties Llc
Bought by
Quality Home Builders Of Carolinas Inc
Create a Home Valuation Report for This Property
The Home Valuation Report is an in-depth analysis detailing your home's value as well as a comparison with similar homes in the area
Home Values in the Area
Average Home Value in this Area
Purchase History
| Date | Buyer | Sale Price | Title Company |
|---|---|---|---|
| Carmendy David | $145,000 | None Available | |
| Chambers Willie | $150,000 | Investors Title Insurance Co | |
| Quality Home Builders Of Carolinas Inc | $30,000 | None Available |
Source: Public Records
Mortgage History
| Date | Status | Borrower | Loan Amount |
|---|---|---|---|
| Open | Carmendy David | $138,710 | |
| Previous Owner | Chambers Willie | $127,500 |
Source: Public Records
Tax History Compared to Growth
Tax History
| Year | Tax Paid | Tax Assessment Tax Assessment Total Assessment is a certain percentage of the fair market value that is determined by local assessors to be the total taxable value of land and additions on the property. | Land | Improvement |
|---|---|---|---|---|
| 2025 | $3,093 | $255,628 | $36,000 | $219,628 |
| 2024 | $3,093 | $255,628 | $36,000 | $219,628 |
| 2023 | $3,093 | $255,628 | $36,000 | $219,628 |
| 2022 | $2,162 | $167,938 | $30,000 | $137,938 |
| 2021 | $2,162 | $167,938 | $30,000 | $137,938 |
| 2020 | $2,162 | $167,938 | $30,000 | $137,938 |
| 2019 | $2,162 | $167,938 | $30,000 | $137,938 |
| 2018 | $1,832 | $143,929 | $30,000 | $113,929 |
| 2017 | $1,832 | $143,929 | $30,000 | $113,929 |
| 2016 | $1,832 | $143,929 | $30,000 | $113,929 |
| 2015 | $1,860 | $143,929 | $30,000 | $113,929 |
| 2014 | $1,706 | $136,498 | $30,000 | $106,498 |
Source: Public Records
Map
Nearby Homes
- 1500 Nectar Way Unit 32
- 1305 Winged Way Unit 1
- 3000 Swallowtail Ln Unit 40
- 1315 Winged Way Unit 2
- 3015 Swallowtail Ln Unit 42
- Lot 50 Lavender Ln
- Lot 51 Lavender Ln
- Lot 54 Lavender Ln
- 2105 Woodlawn St
- Lot 16 New Life Ln Unit 16
- 2008 Woodlawn St
- 700 Wright Ave
- 776 Washington Ln
- 569 Hunter Ave
- 2521 Echerd St
- 520 Wright Ave
- 1905 Clay St
- 0000 Lane St
- 2518 Moose Rd
- Escape Plan at Fisher Springs
- 2138 Charles Towne Ct
- 2126 Charles Towne Ct
- 2144 Charles Towne Ct
- 2120 Charles Towne Ct
- 2129 Bertha St
- 2150 Charles Towne Ct
- 2137 Charles Towne Ct
- 2131 Charles Towne Ct
- 2143 Charles Towne Ct
- 2131 Bertha St
- 2156 Charles Towne Ct
- 2156 Charles Towne Ct Unit 5
- 2149 Charles Towne Ct
- 2128 Bertha St
- 2155 Charles Towne Ct
- 2126 Bertha St
- 2162 Charles Towne Ct
- 2130 Bertha St
- 2133 Bertha St
- 2161 Charles Towne Ct