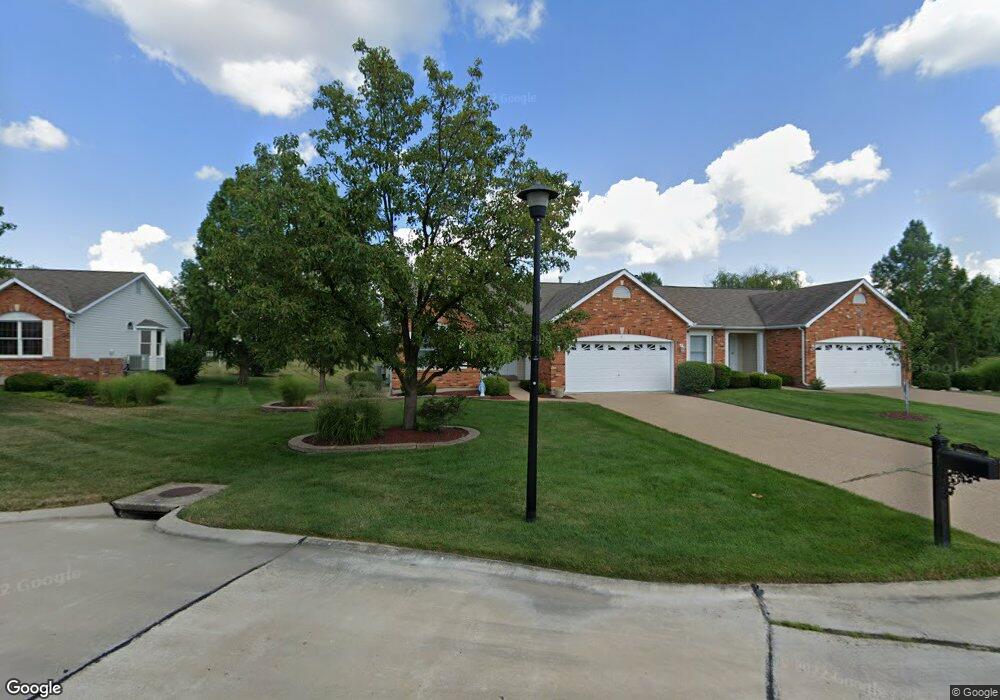
2132 Ingalls Cir Unit A O Fallon, MO 63368
Estimated Value: $341,000 - $354,000
About This Home
This home is located at 2132 Ingalls Cir Unit A, O Fallon, MO 63368 and is currently estimated at $348,197, approximately $248 per square foot. 2132 Ingalls Cir Unit A is a home located in St. Charles County with nearby schools including Pheasant Point Elementary School, Fort Zumwalt West Middle School, and Fort Zumwalt West High School.
Ownership History
Purchase Details
Home Financials for this Owner
Home Financials are based on the most recent Mortgage that was taken out on this home.Purchase Details
Home Financials for this Owner
Home Financials are based on the most recent Mortgage that was taken out on this home.Purchase Details
Home Values in the Area
Average Home Value in this Area
Purchase History
We collect this data history from publicly available records. To have your information removed, we recommend requesting removal directly through your county’s website.
| Date | Buyer | Sale Price | Title Company |
|---|---|---|---|
| Winter Jason | -- | Select Title Group | |
| Nettler Paul | -- | Title Partners Agency Llc | |
| Bergen Jack L | $167,863 | -- |
Mortgage History
We collect this data history from publicly available records. To have your information removed, we recommend requesting removal directly through your county’s website.
| Date | Status | Borrower | Loan Amount |
|---|---|---|---|
| Open | Winter Jason | $294,500 | |
| Previous Owner | Nettler Paul | $138,750 |
Tax History
| Year | Tax Paid | Tax Assessment Tax Assessment Total Assessment is a certain percentage of the fair market value that is determined by local assessors to be the total taxable value of land and additions on the property. | Land | Improvement |
|---|---|---|---|---|
| 2025 | $3,544 | $59,810 | -- | -- |
| 2023 | $3,545 | $53,507 | -- | -- |
| 2022 | $3,236 | $45,416 | $0 | $0 |
| 2021 | $3,238 | $45,416 | $0 | $0 |
| 2020 | $3,083 | $41,892 | $0 | $0 |
| 2019 | $3,090 | $41,892 | $0 | $0 |
| 2018 | $2,860 | $36,998 | $0 | $0 |
| 2017 | $2,821 | $36,998 | $0 | $0 |
| 2016 | $2,616 | $34,162 | $0 | $0 |
| 2015 | $2,432 | $34,162 | $0 | $0 |
| 2014 | $2,229 | $30,793 | $0 | $0 |
Map
- 6964 Brassel Dr
- 2218 Quaint Cottage Dr
- 28 Tournament Tee Dr Unit 708C
- 2461 Shetland Dr
- 14 Rock Church Dr
- 7109 Scotland Dr
- 2849 Royallvalley Way
- 536 Montrachet Dr
- 245 Strathmoor Way
- 37 Jacqueline Cir
- 798 Wilbie Ct
- 516 Sunward Dr
- 2 the Durango at the Grove
- 32 Lemhi Pass Ct
- 7357 Macleod Ln
- 2457 Dunheath Ln
- 13 Macleod Ct
- 6519 Star Buck Dr
- 1 Dragonstone Ct
- 2 Wing Stem Ct
- 2132 Ingalls Cir
- 2134 Ingalls Cir
- 2134 Ingalls Cir Unit B
- 2130 Ingalls Cir
- 2136 Ingalls Cir
- 2128 Ingalls Cir
- 15 Bates Ct
- 2138 Ingalls Cir
- 16 Bates Ct
- 2143 Ingalls Cir
- 2124 Ingalls Cir
- 2140 Ingalls Cir
- 2129 Ingalls Cir
- 2105 Brassel Ct
- 2127 Ingalls Cir
- 2142 Ingalls Cir
- 2145 Ingalls Cir
- 2101 Brassel Ct
- 2122 Ingalls Cir
- 13 Bates Ct
Ask me questions while you tour the home.