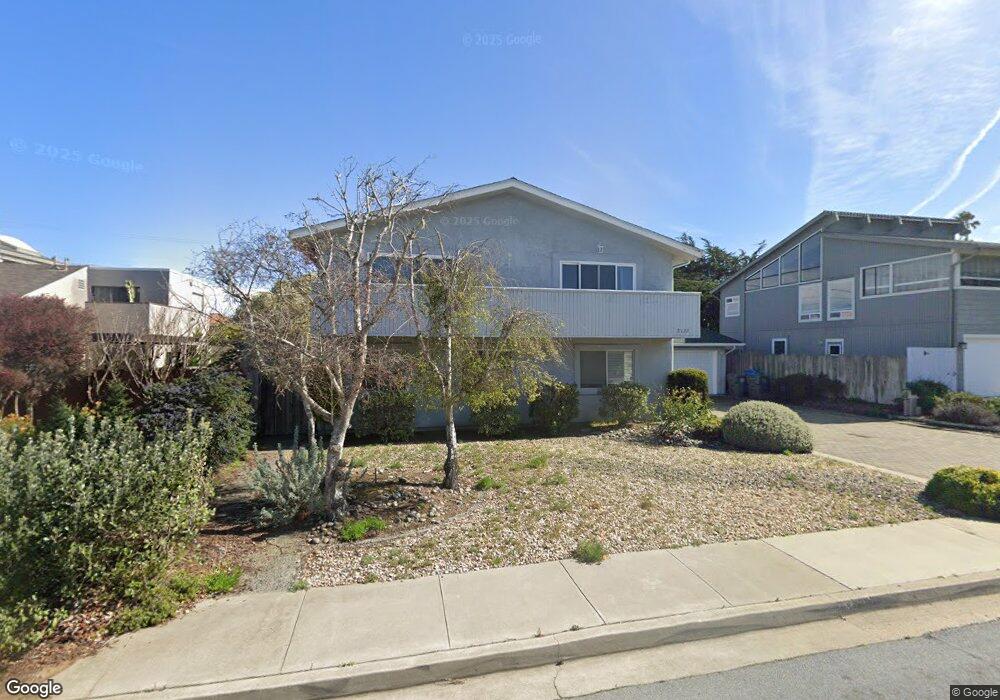
2132 Inyo St Los Osos, CA 93402
Estimated Value: $1,197,000 - $1,377,000
5
Beds
3
Baths
2,543
Sq Ft
$496/Sq Ft
Est. Value
About This Home
This home is located at 2132 Inyo St, Los Osos, CA 93402 and is currently estimated at $1,260,293, approximately $495 per square foot. 2132 Inyo St is a home located in San Luis Obispo County with nearby schools including Monarch Grove Elementary School, Los Osos Middle School, and Morro Bay High School.
Ownership History
Date
Name
Owned For
Owner Type
Purchase Details
Closed on
Jan 31, 2019
Sold by
Butler Peter C
Bought by
Proper Butler Peter Cawood and Proper Peter C Butler Separate
Current Estimated Value
Purchase Details
Closed on
Apr 19, 2017
Sold by
Butler Peter C and Butler Alexandra E
Bought by
Butler Peter C
Purchase Details
Closed on
Aug 12, 2003
Sold by
Degroot Daniel M and Daniel M Degroot Separate Prop
Bought by
Butler Peter and Butler Alexandra
Purchase Details
Closed on
Aug 1, 2002
Sold by
Degroot Daniel M
Bought by
Degroot Daniel M and Daniel M Degroot Separate Prop
Purchase Details
Closed on
Feb 7, 2000
Sold by
Degroot Daniel M
Bought by
Degroot Daniel M and The Daniel M Degroot Separate
Purchase Details
Closed on
Jan 31, 1996
Sold by
Degrott Donald J and Degroot Barbara H
Bought by
Degroot Daniel M
Purchase Details
Closed on
Jul 6, 1994
Sold by
Degroot Susan J
Bought by
Degroot Daniel M
Create a Home Valuation Report for This Property
The Home Valuation Report is an in-depth analysis detailing your home's value as well as a comparison with similar homes in the area
Home Values in the Area
Average Home Value in this Area
Purchase History
| Date | Buyer | Sale Price | Title Company |
|---|---|---|---|
| Proper Butler Peter Cawood | -- | None Available | |
| Butler Peter C | -- | None Available | |
| Butler Peter | $490,000 | Cuesta Title Company | |
| Degroot Daniel M | -- | -- | |
| Degroot Daniel M | -- | -- | |
| Degroot Daniel M | -- | -- | |
| Degroot Daniel M | -- | -- |
Source: Public Records
Tax History
| Year | Tax Paid | Tax Assessment Tax Assessment Total Assessment is a certain percentage of the fair market value that is determined by local assessors to be the total taxable value of land and additions on the property. | Land | Improvement |
|---|---|---|---|---|
| 2025 | $9,921 | $696,659 | $355,440 | $341,219 |
| 2024 | $9,752 | $683,000 | $348,471 | $334,529 |
| 2023 | $9,752 | $669,609 | $341,639 | $327,970 |
| 2022 | $9,559 | $656,481 | $334,941 | $321,540 |
| 2021 | $9,091 | $643,610 | $328,374 | $315,236 |
| 2020 | $9,247 | $637,011 | $325,007 | $312,004 |
| 2019 | $8,900 | $624,522 | $318,635 | $305,887 |
| 2018 | $8,614 | $612,278 | $312,388 | $299,890 |
| 2017 | $8,698 | $600,273 | $306,263 | $294,010 |
| 2016 | $7,357 | $588,504 | $300,258 | $288,246 |
| 2015 | $7,261 | $579,665 | $295,748 | $283,917 |
| 2014 | $6,742 | $568,311 | $289,955 | $278,356 |
Source: Public Records
Map
Nearby Homes
- 2265 Del Norte St
- 1924 Nevada Ct
- 224 Butte Dr
- 230 Butte Dr
- 0 Garden St
- 2493 San Sebastian Ln
- 200 Madera St
- 286 San Leandro Ave
- 305 Henrietta Ave
- 85 Costa Azul
- 2045 Pine Ave
- 1766 Fearn Ave
- 1840 Pine Ave
- 1830 Pine Ave
- 0 Ash St
- 2743 Rodman Dr
- 1765 Pine Ave
- 2796 Crockett Cir
- 633 Ramona Ave Unit 19
- 633 Ramona Ave Unit 26
Your Personal Tour Guide
Ask me questions while you tour the home.