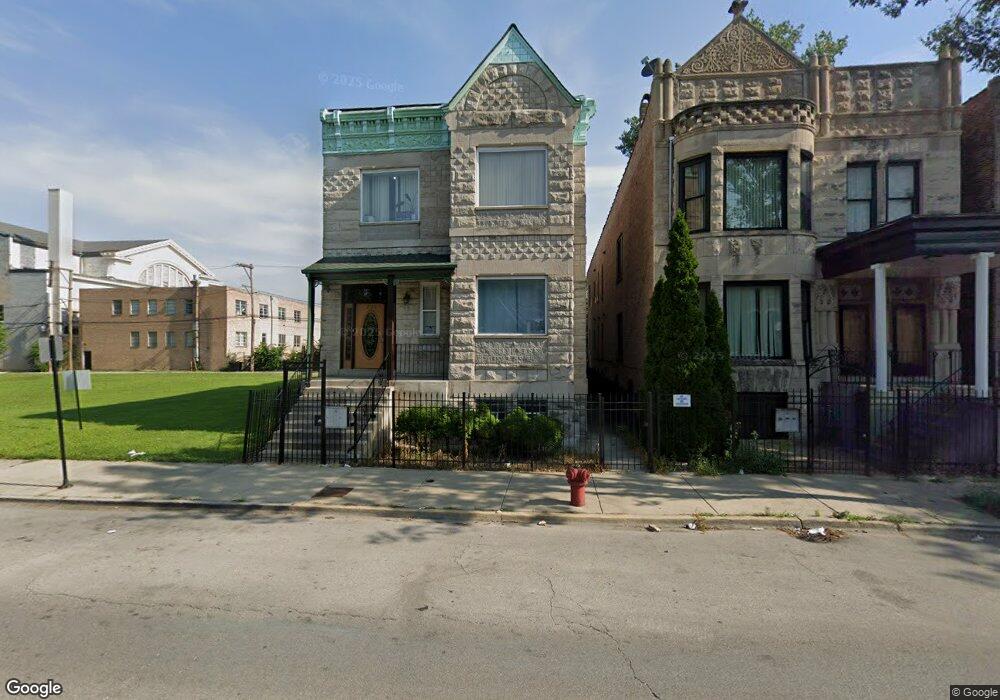
2132 W Warren Blvd Unit 2 Chicago, IL 60612
United Center NeighborhoodEstimated Value: $295,000 - $473,000
3
Beds
3
Baths
6,108
Sq Ft
$60/Sq Ft
Est. Value
About This Home
This home is located at 2132 W Warren Blvd Unit 2, Chicago, IL 60612 and is currently estimated at $366,735, approximately $60 per square foot. 2132 W Warren Blvd Unit 2 is a home located in Cook County with nearby schools including Dett Elementary School, Marshall Metropolitan High School, and Chicago Bulls College Prep.
Ownership History
Date
Name
Owned For
Owner Type
Purchase Details
Closed on
Jul 22, 2021
Sold by
Happy River Llc 2
Bought by
Jrda2 Properties Llc
Current Estimated Value
Purchase Details
Closed on
Dec 27, 2017
Sold by
Da Silva Jonas
Bought by
Happy River Llc 2
Purchase Details
Closed on
Sep 25, 2008
Sold by
Us Bank National Association
Bought by
Dasilva Jonas
Purchase Details
Closed on
Jun 13, 2007
Sold by
Auskalnis Ramunas
Bought by
Us Bank Na
Purchase Details
Closed on
Nov 14, 2005
Sold by
Sieniewicz Andrzej
Bought by
Auskaluis Ramunas
Home Financials for this Owner
Home Financials are based on the most recent Mortgage that was taken out on this home.
Original Mortgage
$405,000
Interest Rate
9.9%
Mortgage Type
Fannie Mae Freddie Mac
Create a Home Valuation Report for This Property
The Home Valuation Report is an in-depth analysis detailing your home's value as well as a comparison with similar homes in the area
Home Values in the Area
Average Home Value in this Area
Purchase History
| Date | Buyer | Sale Price | Title Company |
|---|---|---|---|
| Jrda2 Properties Llc | -- | Attorney | |
| Happy River Llc 2 | -- | Attorney | |
| Dasilva Jonas | $89,000 | First American Title | |
| Us Bank Na | -- | None Available | |
| Auskaluis Ramunas | $450,000 | Chicago Title Insurance Comp |
Source: Public Records
Mortgage History
| Date | Status | Borrower | Loan Amount |
|---|---|---|---|
| Previous Owner | Auskaluis Ramunas | $405,000 |
Source: Public Records
Tax History Compared to Growth
Tax History
| Year | Tax Paid | Tax Assessment Tax Assessment Total Assessment is a certain percentage of the fair market value that is determined by local assessors to be the total taxable value of land and additions on the property. | Land | Improvement |
|---|---|---|---|---|
| 2024 | $5,447 | $46,260 | $8,797 | $37,463 |
| 2023 | $5,310 | $25,729 | $4,824 | $20,905 |
| 2022 | $5,310 | $25,729 | $4,824 | $20,905 |
| 2021 | $5,191 | $25,729 | $4,824 | $20,905 |
| 2020 | $3,726 | $16,669 | $4,824 | $11,845 |
| 2019 | $3,678 | $18,244 | $4,824 | $13,420 |
| 2018 | $3,615 | $18,244 | $4,824 | $13,420 |
| 2017 | $3,130 | $14,489 | $4,256 | $10,233 |
| 2016 | $2,902 | $14,489 | $4,256 | $10,233 |
| 2015 | $2,655 | $14,489 | $4,256 | $10,233 |
| 2014 | $1,071 | $5,770 | $3,618 | $2,152 |
| 2013 | $1,049 | $5,770 | $3,618 | $2,152 |
Source: Public Records
Map
Nearby Homes
- 2058 W Washington Blvd
- 2 S Leavitt St Unit 201
- 2 S Leavitt St Unit 206
- 14 S Leavitt St
- 2249 W Warren Blvd
- 2225 W Madison St Unit 7
- 2226 W Monroe St Unit 3
- 2226 W Monroe St Unit 4
- 117 S Bell Ave Unit 4N
- 2324 W Warren Blvd
- 2333 W Warren Blvd
- 2334 W Washington Blvd
- 2123 W Adams St
- 2147 W Adams St Unit 2S
- 2147 W Adams St Unit 3S
- 2147 W Adams St Unit 1S
- 2147 W Adams St Unit 3N
- 2147 W Adams St Unit 2N
- 2147 W Adams St Unit 1N
- 2347 W Maypole Ave
- 2132 W Warren Blvd Unit 3
- 2132 W Warren Blvd Unit 1
- 2126 W Warren Blvd
- 2124 W Warren Blvd
- 2131 W Washington Blvd
- 2131 W Washington Blvd
- 2129 W Washington Blvd Unit 212
- 2127 W Washington Blvd Unit 212
- 2129 W Washington Blvd Unit 212
- 2129 W Washington Blvd Unit 212
- 2127 W Washington Blvd Unit 212
- 2127 W Washington Blvd Unit 212
- 2127 W Washington Blvd Unit C
- 2127 W Washington Blvd Unit B
- 2125 W Washington Blvd Unit 212
- 2125 W Washington Blvd Unit 212
- 2125 W Washington Blvd Unit 212
- 2125 W Washington Blvd Unit A
- 2125 W Washington Blvd
- 2117 W Washington Blvd