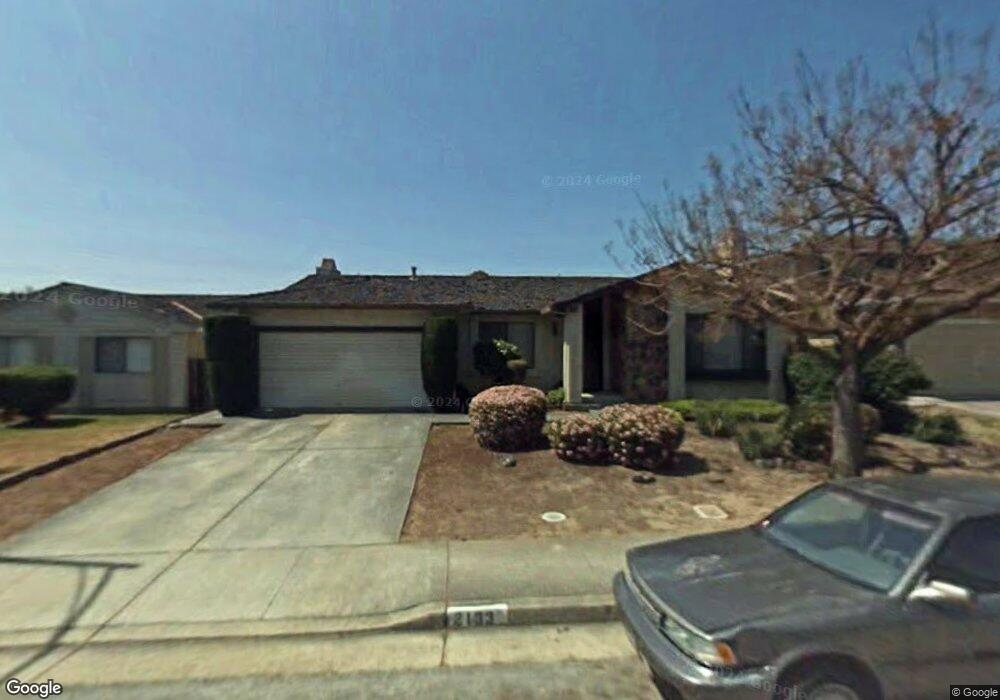
2133 Flintmore Ct San Jose, CA 95148
Mount Pleasant NeighborhoodEstimated Value: $955,000 - $1,637,000
4
Beds
2
Baths
1,739
Sq Ft
$769/Sq Ft
Est. Value
About This Home
This home is located at 2133 Flintmore Ct, San Jose, CA 95148 and is currently estimated at $1,336,886, approximately $768 per square foot. 2133 Flintmore Ct is a home located in Santa Clara County with nearby schools including Mt. Pleasant High School, Ida Jew Academies, and Adelante Dual Language Academy.
Ownership History
Date
Name
Owned For
Owner Type
Purchase Details
Closed on
Apr 13, 2021
Sold by
Mercado Jose C
Bought by
Mercado Jose Carlos and Caruana Tracy Jo
Current Estimated Value
Home Financials for this Owner
Home Financials are based on the most recent Mortgage that was taken out on this home.
Original Mortgage
$174,500
Outstanding Balance
$144,418
Interest Rate
3%
Mortgage Type
New Conventional
Estimated Equity
$1,192,468
Create a Home Valuation Report for This Property
The Home Valuation Report is an in-depth analysis detailing your home's value as well as a comparison with similar homes in the area
Home Values in the Area
Average Home Value in this Area
Purchase History
| Date | Buyer | Sale Price | Title Company |
|---|---|---|---|
| Mercado Jose Carlos | $475,000 | Atlas Title Company |
Source: Public Records
Mortgage History
| Date | Status | Borrower | Loan Amount |
|---|---|---|---|
| Open | Mercado Jose Carlos | $174,500 |
Source: Public Records
Tax History Compared to Growth
Tax History
| Year | Tax Paid | Tax Assessment Tax Assessment Total Assessment is a certain percentage of the fair market value that is determined by local assessors to be the total taxable value of land and additions on the property. | Land | Improvement |
|---|---|---|---|---|
| 2025 | $4,719 | $251,645 | $84,492 | $167,153 |
| 2024 | $4,719 | $246,712 | $82,836 | $163,876 |
| 2023 | $4,538 | $241,875 | $81,212 | $160,663 |
| 2022 | $4,499 | $237,133 | $79,620 | $157,513 |
| 2021 | $4,366 | $232,484 | $78,059 | $154,425 |
| 2020 | $4,174 | $230,101 | $77,259 | $152,842 |
| 2019 | $4,055 | $225,591 | $75,745 | $149,846 |
| 2018 | $3,941 | $221,168 | $74,260 | $146,908 |
| 2017 | $3,881 | $216,832 | $72,804 | $144,028 |
| 2016 | $3,747 | $212,581 | $71,377 | $141,204 |
| 2015 | $3,731 | $209,388 | $70,305 | $139,083 |
| 2014 | $3,280 | $205,287 | $68,928 | $136,359 |
Source: Public Records
Map
Nearby Homes
- 2209 Fairmont Dr
- 3440 Rubion Dr
- 2277 Flint Ave
- 1925 Winding Creek Ct
- 3532 Boeger Ln
- 2145 Mount Pleasant Rd
- 3286 Dias Dr
- 2017 Flintbury Ct
- 2467 Flint Ave
- 3156 Coldwater Dr
- 3144 Coldwater Dr
- 3146 Marten Ave
- 3274 Mount Rainier Dr
- 3324 Trebol Ln
- 2689 Vista Verde Dr
- 3416 Mount Mckinley Ct
- 2703 Klein Rd
- 3514 Milburn St
- 2837 Mantis Dr
- 2195 Cunningham Ct
- 2139 Flintmore Ct
- 2129 Flintmore Ct
- 2126 Flintside Ct
- 2118 Flintside Ct
- 2145 Flintmore Ct
- 2134 Flintside Ct
- 2123 Flintmore Ct
- 2110 Flintside Ct
- 2132 Flintmore Ct
- 2138 Flintmore Ct
- 2128 Flintmore Ct
- 2149 Flintmore Ct
- 2142 Flintside Ct
- 2144 Flintmore Ct
- 2115 Flintmore Ct
- 2102 Flintside Ct
- 2148 Flintmore Ct
- 2122 Flintmore Ct
- 2116 Flintmore Ct
- 2150 Flintside Ct