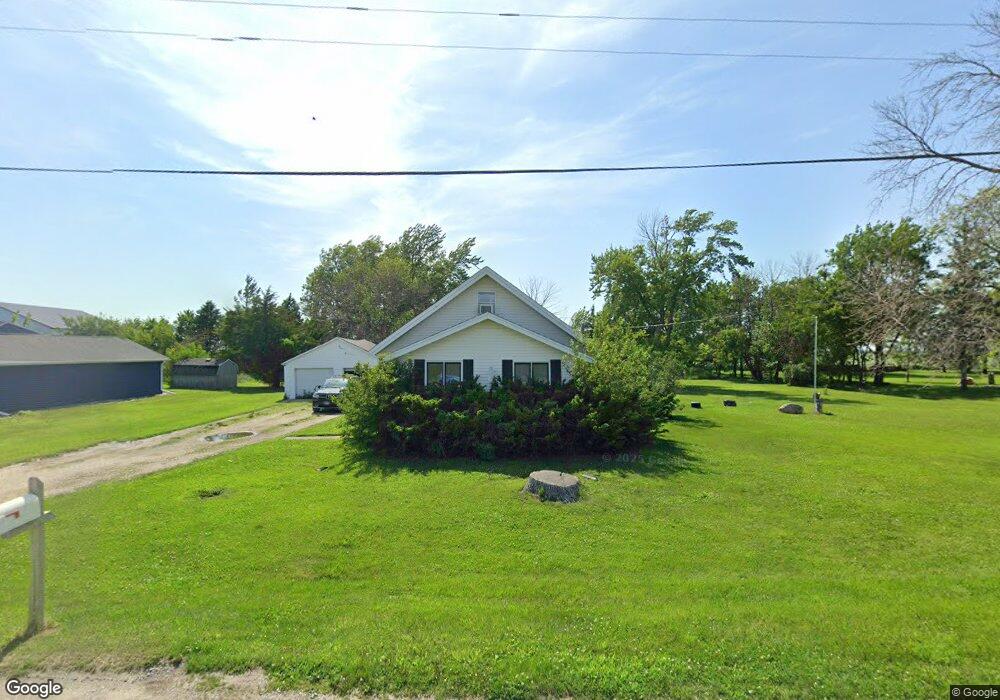
2133 Hancock Ave Clarion, IA 50525
Estimated Value: $70,000 - $128,000
3
Beds
1
Bath
917
Sq Ft
$99/Sq Ft
Est. Value
About This Home
This home is located at 2133 Hancock Ave, Clarion, IA 50525 and is currently estimated at $90,671, approximately $98 per square foot. 2133 Hancock Ave is a home located in Wright County with nearby schools including Clarion-Goldfield-Dows Elementary School, Clarion-Goldfield-Dows Middle School, and Clarion-Goldfield-Dows High School.
Ownership History
Date
Name
Owned For
Owner Type
Purchase Details
Closed on
Feb 5, 2016
Sold by
Range Tammy D and Range Arnoid E
Bought by
Range Tammy D and Range Arnold E
Current Estimated Value
Purchase Details
Closed on
May 8, 2008
Sold by
Prehm John and Prehm Jeanette E
Bought by
Range Arnold E and Range Tammy D
Home Financials for this Owner
Home Financials are based on the most recent Mortgage that was taken out on this home.
Original Mortgage
$28,000
Interest Rate
5.88%
Mortgage Type
Future Advance Clause Open End Mortgage
Create a Home Valuation Report for This Property
The Home Valuation Report is an in-depth analysis detailing your home's value as well as a comparison with similar homes in the area
Home Values in the Area
Average Home Value in this Area
Purchase History
| Date | Buyer | Sale Price | Title Company |
|---|---|---|---|
| Range Tammy D | -- | None Available | |
| Range Arnold E | $35,000 | None Available |
Source: Public Records
Mortgage History
| Date | Status | Borrower | Loan Amount |
|---|---|---|---|
| Closed | Range Arnold E | $28,000 |
Source: Public Records
Tax History Compared to Growth
Tax History
| Year | Tax Paid | Tax Assessment Tax Assessment Total Assessment is a certain percentage of the fair market value that is determined by local assessors to be the total taxable value of land and additions on the property. | Land | Improvement |
|---|---|---|---|---|
| 2025 | $494 | $63,300 | $3,500 | $59,800 |
| 2024 | $494 | $49,200 | $3,500 | $45,700 |
| 2023 | $560 | $49,200 | $3,500 | $45,700 |
| 2022 | $418 | $46,700 | $3,500 | $43,200 |
| 2021 | $418 | $37,800 | $3,500 | $34,300 |
| 2020 | $392 | $35,900 | $3,500 | $32,400 |
| 2019 | $387 | $35,000 | $0 | $0 |
| 2018 | $480 | $35,000 | $0 | $0 |
| 2017 | $388 | $35,200 | $0 | $0 |
| 2016 | $368 | $35,200 | $0 | $0 |
| 2015 | $362 | $35,200 | $0 | $0 |
| 2014 | $362 | $38,900 | $0 | $0 |
Source: Public Records
Map
Nearby Homes