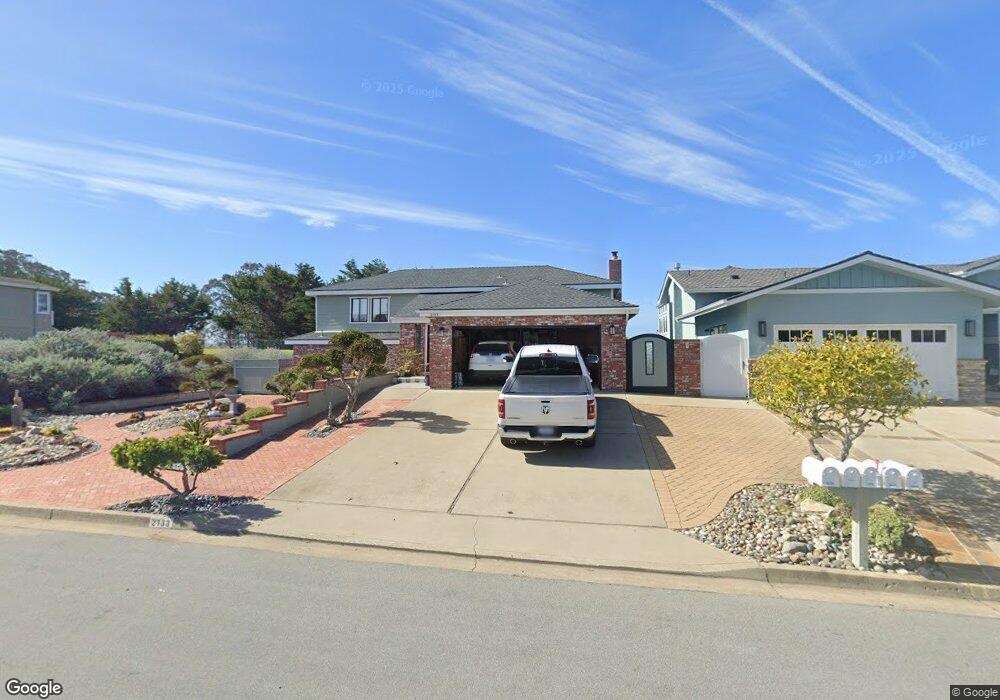
2133 Inyo St Los Osos, CA 93402
Estimated Value: $1,102,733 - $1,185,000
3
Beds
3
Baths
2,262
Sq Ft
$509/Sq Ft
Est. Value
About This Home
This home is located at 2133 Inyo St, Los Osos, CA 93402 and is currently estimated at $1,152,183, approximately $509 per square foot. 2133 Inyo St is a home located in San Luis Obispo County with nearby schools including Monarch Grove Elementary School, Los Osos Middle School, and Morro Bay High School.
Ownership History
Date
Name
Owned For
Owner Type
Purchase Details
Closed on
Sep 9, 2005
Sold by
Henson Jay A and Hahn Henson Janet B
Bought by
Henson Jay A and Hahn Henson Janet B
Current Estimated Value
Purchase Details
Closed on
Nov 30, 1999
Sold by
Henson Jay Alan
Bought by
Henson Jay Alan and Henson Janet B
Purchase Details
Closed on
Jun 15, 1998
Sold by
Hewko Christopher Paul
Bought by
Henson Jay Alan
Purchase Details
Closed on
Jun 12, 1998
Sold by
Henson Jay Alan and Hewko Debra Kim
Bought by
Henson Jay Alan
Create a Home Valuation Report for This Property
The Home Valuation Report is an in-depth analysis detailing your home's value as well as a comparison with similar homes in the area
Home Values in the Area
Average Home Value in this Area
Purchase History
| Date | Buyer | Sale Price | Title Company |
|---|---|---|---|
| Henson Jay A | -- | None Available | |
| Henson Jay Alan | -- | -- | |
| Henson Jay Alan | -- | -- | |
| Henson Jay Alan | -- | -- |
Source: Public Records
Tax History
| Year | Tax Paid | Tax Assessment Tax Assessment Total Assessment is a certain percentage of the fair market value that is determined by local assessors to be the total taxable value of land and additions on the property. | Land | Improvement |
|---|---|---|---|---|
| 2025 | $6,864 | $401,755 | $140,549 | $261,206 |
| 2024 | $6,695 | $393,879 | $137,794 | $256,085 |
| 2023 | $6,695 | $386,157 | $135,093 | $251,064 |
| 2022 | $6,442 | $378,587 | $132,445 | $246,142 |
| 2021 | $6,270 | $371,165 | $129,849 | $241,316 |
| 2020 | $5,991 | $367,360 | $128,518 | $238,842 |
| 2019 | $5,900 | $360,158 | $125,999 | $234,159 |
| 2018 | $5,850 | $353,097 | $123,529 | $229,568 |
| 2017 | $5,672 | $346,174 | $121,107 | $225,067 |
| 2016 | $4,611 | $339,387 | $118,733 | $220,654 |
| 2015 | $4,555 | $334,290 | $116,950 | $217,340 |
| 2014 | $4,256 | $327,743 | $114,660 | $213,083 |
Source: Public Records
Map
Nearby Homes
- 2265 Del Norte St
- 1924 Nevada Ct
- 224 Butte Dr
- 230 Butte Dr
- 0 Garden St
- 2493 San Sebastian Ln
- 200 Madera St
- 286 San Leandro Ave
- 85 Costa Azul
- 305 Henrietta Ave
- 2045 Pine Ave
- 1766 Fearn Ave
- 1840 Pine Ave
- 1830 Pine Ave
- 0 Ash St
- 2743 Rodman Dr
- 2796 Crockett Cir
- 611 Los Osos Valley Rd
- 633 Ramona Ave Unit 19
- 633 Ramona Ave Unit 26
Your Personal Tour Guide
Ask me questions while you tour the home.