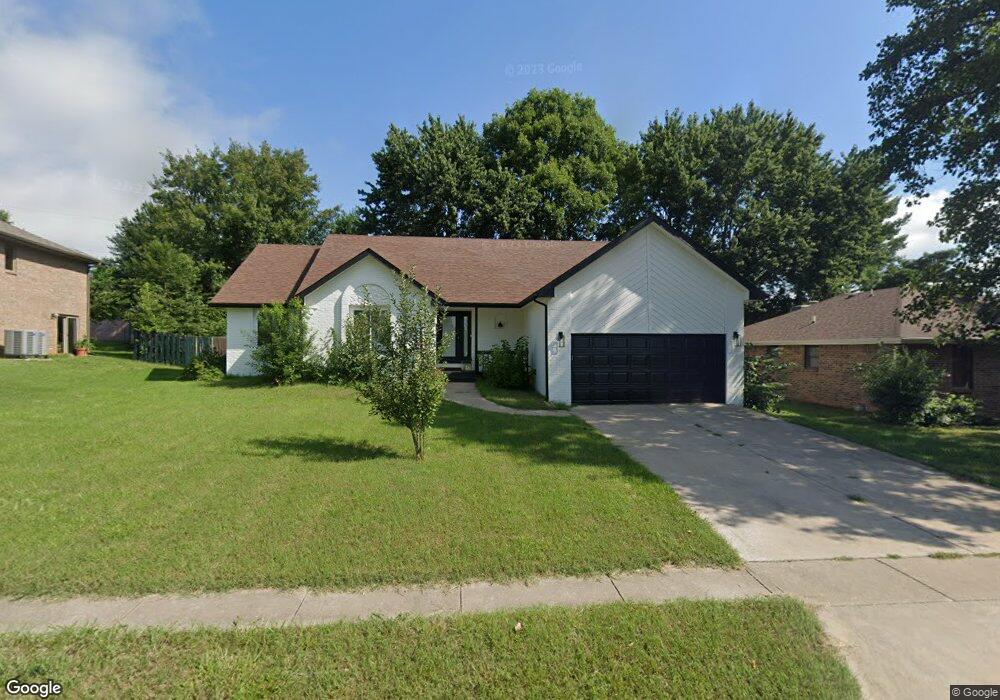
2133 W Nottingham St Springfield, MO 65810
Southwest Springfield NeighborhoodEstimated Value: $278,264 - $345,000
4
Beds
2
Baths
1,769
Sq Ft
$179/Sq Ft
Est. Value
About This Home
This home is located at 2133 W Nottingham St, Springfield, MO 65810 and is currently estimated at $316,066, approximately $178 per square foot. 2133 W Nottingham St is a home located in Greene County with nearby schools including Gray Elementary School, Wilson's Creek Intermediate School, and Cherokee Middle School.
Ownership History
Date
Name
Owned For
Owner Type
Purchase Details
Closed on
Aug 18, 2022
Sold by
Spring Street Investments Llc
Bought by
Mindock Jeffrey and Mindock Paige
Current Estimated Value
Home Financials for this Owner
Home Financials are based on the most recent Mortgage that was taken out on this home.
Original Mortgage
$270,000
Outstanding Balance
$257,697
Interest Rate
5.3%
Mortgage Type
New Conventional
Estimated Equity
$58,369
Purchase Details
Closed on
Apr 6, 2022
Sold by
G & S Partners Llc
Bought by
Spring Street Investments Llc
Purchase Details
Closed on
Mar 18, 2022
Sold by
Hickey and Virginia
Bought by
G & S Partners Llc
Purchase Details
Closed on
Oct 2, 2009
Sold by
Willis Roger and Willis Karen P
Bought by
Hickey John and Hickey Belinda
Home Financials for this Owner
Home Financials are based on the most recent Mortgage that was taken out on this home.
Original Mortgage
$127,546
Interest Rate
5.12%
Mortgage Type
FHA
Purchase Details
Closed on
Nov 28, 2005
Sold by
Kniepfel Gary and Kniepfel Michele L
Bought by
Harrell Karn P
Create a Home Valuation Report for This Property
The Home Valuation Report is an in-depth analysis detailing your home's value as well as a comparison with similar homes in the area
Home Values in the Area
Average Home Value in this Area
Purchase History
| Date | Buyer | Sale Price | Title Company |
|---|---|---|---|
| Mindock Jeffrey | -- | None Listed On Document | |
| Spring Street Investments Llc | -- | None Listed On Document | |
| G & S Partners Llc | -- | None Listed On Document | |
| Hickey John | -- | Choice Escrow & Land Title L | |
| Harrell Karn P | -- | None Available |
Source: Public Records
Mortgage History
| Date | Status | Borrower | Loan Amount |
|---|---|---|---|
| Open | Mindock Jeffrey | $270,000 | |
| Previous Owner | Hickey John | $127,546 |
Source: Public Records
Tax History
| Year | Tax Paid | Tax Assessment Tax Assessment Total Assessment is a certain percentage of the fair market value that is determined by local assessors to be the total taxable value of land and additions on the property. | Land | Improvement |
|---|---|---|---|---|
| 2025 | $1,771 | $34,370 | $6,760 | $27,610 |
| 2024 | $1,819 | $32,850 | $6,760 | $26,090 |
| 2023 | $1,810 | $32,850 | $6,760 | $26,090 |
| 2022 | $1,642 | $30,550 | $6,760 | $23,790 |
| 2021 | $1,641 | $30,550 | $6,760 | $23,790 |
| 2020 | $1,593 | $28,120 | $6,760 | $21,360 |
| 2019 | $1,548 | $28,120 | $6,760 | $21,360 |
| 2018 | $1,364 | $24,730 | $6,760 | $17,970 |
| 2017 | $1,351 | $24,200 | $6,760 | $17,440 |
| 2016 | $1,322 | $24,200 | $6,760 | $17,440 |
| 2015 | $1,312 | $24,200 | $6,760 | $17,440 |
| 2014 | $1,273 | $23,290 | $6,760 | $16,530 |
Source: Public Records
Map
Nearby Homes
- 1978 W Williamsburg St
- 5375 S Twelve Oaks Rd
- 5350 S Parklane Ave
- 2063 W Melbourne Ct
- 2047 W Blakey St
- 5396 S Woodfield Ave
- 1747 W Nottingham St
- 2240 W Alta St
- 1920 W Murray Dr
- 00 W Farm Road 182
- 5389 S Clifton Ave
- 1658 W Caleb Ct
- 1532 W Fancrest Ln
- 2680 W Williamsburg St
- 4715 S Elizabeth Ave
- 5021 S Farm Rd 137
- 5637 S Lexington Ave
- 4566 S Park Ave
- 2534 W Grayrock St
- 3032 W Allen Dr
- 2119 W Nottingham St
- 2155 W Nottingham St
- 2132 W Arlington St
- 2150 W Arlington St
- 2118 W Arlington St
- 2099 W Nottingham St
- 2122 W Nottingham St
- 2144 W Nottingham St
- 2170 W Arlington St
- 2098 W Arlington St
- 2083 W Nottingham St
- 2102 W Nottingham St
- 2082 W Arlington St
- 2222 W Nottingham St
- 2082 W Nottingham St
- 2065 W Nottingham St
- 2141 W Arlington St
- 2123 W Arlington St
- 2161 W Arlington St
- 2223 W Cantebury St
Your Personal Tour Guide
Ask me questions while you tour the home.