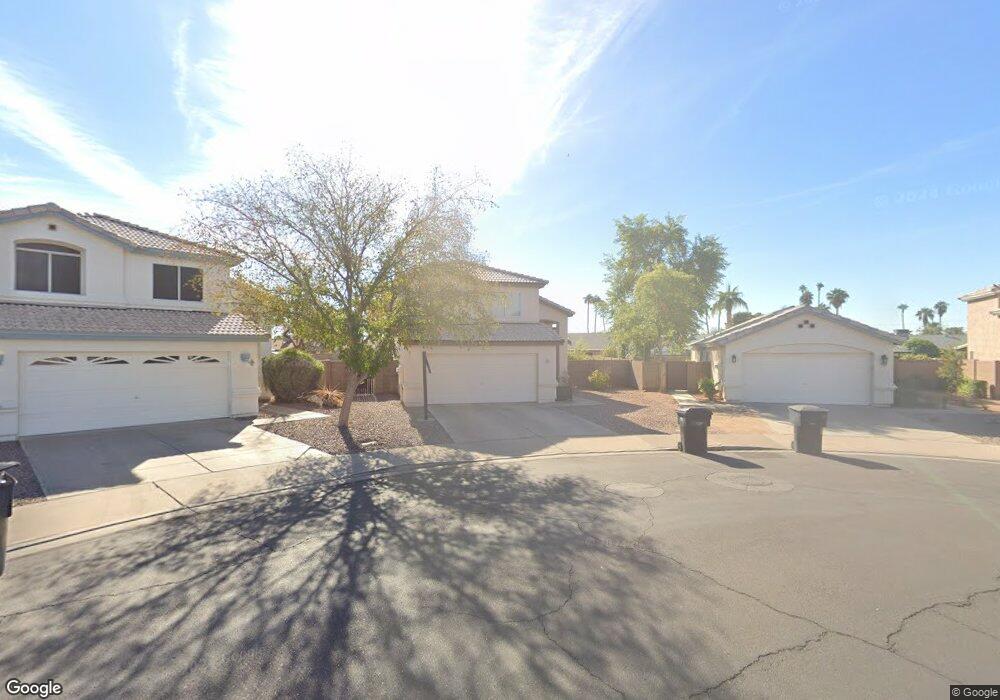
2133 W Osage Ave Mesa, AZ 85202
Dobson NeighborhoodEstimated Value: $464,449 - $520,000
--
Bed
3
Baths
1,910
Sq Ft
$261/Sq Ft
Est. Value
About This Home
This home is located at 2133 W Osage Ave, Mesa, AZ 85202 and is currently estimated at $498,862, approximately $261 per square foot. 2133 W Osage Ave is a home located in Maricopa County with nearby schools including Franklin at Brimhall Elementary School, Franklin Accelerated Academy Jordan Campus, and Washington Elementary School.
Ownership History
Date
Name
Owned For
Owner Type
Purchase Details
Closed on
Nov 24, 1998
Sold by
Black Brenda D
Bought by
To Hung and To Elena M
Current Estimated Value
Home Financials for this Owner
Home Financials are based on the most recent Mortgage that was taken out on this home.
Original Mortgage
$139,100
Outstanding Balance
$31,815
Interest Rate
6.86%
Mortgage Type
New Conventional
Estimated Equity
$467,047
Purchase Details
Closed on
Oct 24, 1995
Sold by
The Keystone Companies Inc
Bought by
Black Brenda D
Home Financials for this Owner
Home Financials are based on the most recent Mortgage that was taken out on this home.
Original Mortgage
$110,000
Interest Rate
7.59%
Mortgage Type
New Conventional
Purchase Details
Closed on
Apr 18, 1994
Sold by
Hundelt Gary and Hundelt Mary Eileen
Bought by
Eneim Richard M and Eneim Kathryn Anne
Create a Home Valuation Report for This Property
The Home Valuation Report is an in-depth analysis detailing your home's value as well as a comparison with similar homes in the area
Home Values in the Area
Average Home Value in this Area
Purchase History
| Date | Buyer | Sale Price | Title Company |
|---|---|---|---|
| To Hung | $146,500 | Capital Title Agency | |
| Black Brenda D | $132,435 | Transamerica Title Ins Co | |
| Eneim Richard M | $140,000 | Fidelity Title |
Source: Public Records
Mortgage History
| Date | Status | Borrower | Loan Amount |
|---|---|---|---|
| Open | To Hung | $139,100 | |
| Previous Owner | Black Brenda D | $110,000 |
Source: Public Records
Tax History Compared to Growth
Tax History
| Year | Tax Paid | Tax Assessment Tax Assessment Total Assessment is a certain percentage of the fair market value that is determined by local assessors to be the total taxable value of land and additions on the property. | Land | Improvement |
|---|---|---|---|---|
| 2025 | $1,828 | $22,012 | -- | -- |
| 2024 | $1,848 | $20,964 | -- | -- |
| 2023 | $1,848 | $39,150 | $7,830 | $31,320 |
| 2022 | $1,807 | $28,170 | $5,630 | $22,540 |
| 2021 | $1,857 | $27,880 | $5,570 | $22,310 |
| 2020 | $1,832 | $24,900 | $4,980 | $19,920 |
| 2019 | $1,697 | $23,680 | $4,730 | $18,950 |
| 2018 | $1,621 | $22,360 | $4,470 | $17,890 |
| 2017 | $1,570 | $21,260 | $4,250 | $17,010 |
| 2016 | $1,541 | $20,810 | $4,160 | $16,650 |
| 2015 | $1,455 | $18,850 | $3,770 | $15,080 |
Source: Public Records
Map
Nearby Homes
- 2030 W Portobello Ave
- 2309 W Naranja Ave
- 2043 W Nopal Ave
- 2958 S El Paradiso
- 1910 W Onza Ave
- 2334 W Peralta Ave
- 1853 W Plata Ave
- 2453 W Pecos Ave
- 2554 S Salida Del Sol
- 2937 S Pennington
- 2014 W Summit Place
- 2559 W Olla Cir
- 2552 S Playa
- 2722 S Pennington
- 2637 S El Paradiso
- 2642 W Onza Ave
- 1639 W Nido Ave
- 2524 S El Paradiso Unit 22
- 2524 S El Paradiso Unit 32
- 2524 S El Paradiso Unit 50
- 2847 S Paseo Loma
- 2137 W Osage Ave
- 2124 W Obispo Ave
- 2141 W Osage Ave
- 2116 W Obispo Ave
- 2843 S Paseo Loma
- 2145 W Osage Ave
- 2839 S Paseo Loma
- 2112 W Obispo Ave
- 2138 W Obispo Ave
- 2842 S Paseo Loma
- 2149 W Osage Ave
- 2835 S Paseo Loma
- 2838 S Paseo Loma
- 2104 W Obispo Ave
- 2144 W Obispo Ave
- 1095 W Osage Ave
- 2834 S Paseo Loma
- 2153 W Osage Ave
- 2125 W Obispo Ave