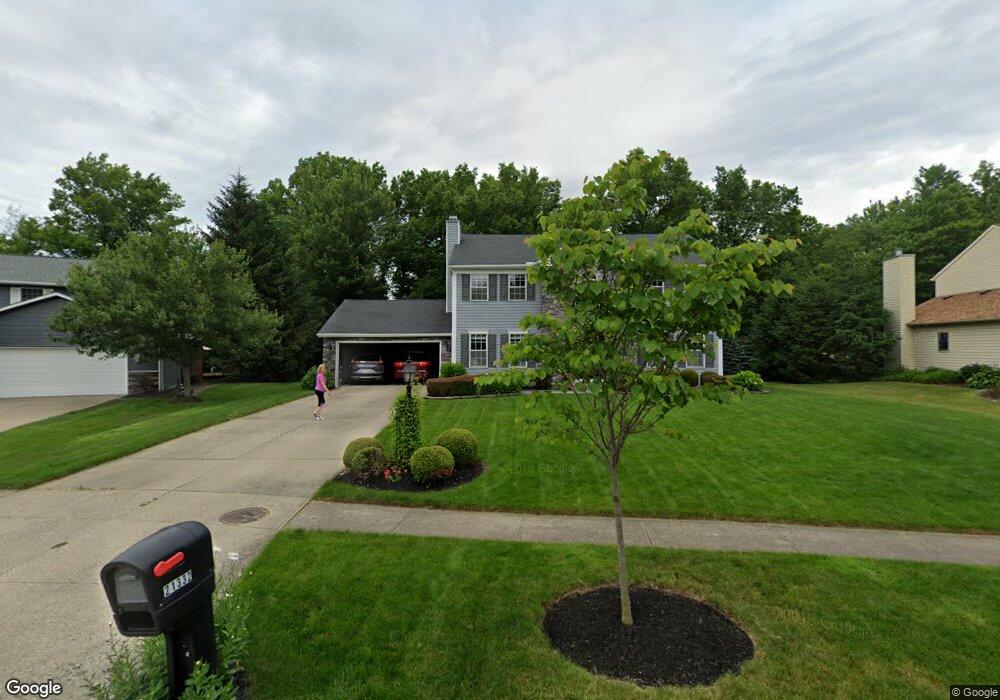
21332 Montclare Blvd Strongsville, OH 44149
Estimated Value: $407,816 - $450,000
4
Beds
3
Baths
2,382
Sq Ft
$180/Sq Ft
Est. Value
About This Home
This home is located at 21332 Montclare Blvd, Strongsville, OH 44149 and is currently estimated at $429,204, approximately $180 per square foot. 21332 Montclare Blvd is a home located in Cuyahoga County with nearby schools including Strongsville High School, St Mary School, and Sts Joseph & John Interparochial School.
Ownership History
Date
Name
Owned For
Owner Type
Purchase Details
Closed on
Dec 1, 2023
Sold by
Kevin R Gulden R and Kevin Nancy L
Bought by
Gilman Cory M and Watts Heather M
Current Estimated Value
Home Financials for this Owner
Home Financials are based on the most recent Mortgage that was taken out on this home.
Original Mortgage
$313,600
Outstanding Balance
$308,003
Interest Rate
7.63%
Mortgage Type
New Conventional
Estimated Equity
$121,201
Purchase Details
Closed on
Dec 6, 2013
Sold by
Gulden Kevin R and Gulden Nancy L
Bought by
Gulden Kevin R and Gulden Nancy L
Purchase Details
Closed on
Jul 6, 1987
Bought by
Gulden Kevin R
Purchase Details
Closed on
Mar 20, 1987
Bought by
Stonecrest Homes Inc
Purchase Details
Closed on
Jan 1, 1985
Bought by
Fair Farms Co
Create a Home Valuation Report for This Property
The Home Valuation Report is an in-depth analysis detailing your home's value as well as a comparison with similar homes in the area
Home Values in the Area
Average Home Value in this Area
Purchase History
| Date | Buyer | Sale Price | Title Company |
|---|---|---|---|
| Gilman Cory M | $392,000 | None Listed On Document | |
| Gulden Kevin R | -- | Prosource Title | |
| Gulden Kevin R | $141,400 | -- | |
| Stonecrest Homes Inc | -- | -- | |
| Fair Farms Co | -- | -- |
Source: Public Records
Mortgage History
| Date | Status | Borrower | Loan Amount |
|---|---|---|---|
| Open | Gilman Cory M | $313,600 |
Source: Public Records
Tax History Compared to Growth
Tax History
| Year | Tax Paid | Tax Assessment Tax Assessment Total Assessment is a certain percentage of the fair market value that is determined by local assessors to be the total taxable value of land and additions on the property. | Land | Improvement |
|---|---|---|---|---|
| 2024 | $5,720 | $121,835 | $20,615 | $101,220 |
| 2023 | $6,104 | $97,480 | $20,300 | $77,180 |
| 2022 | $6,059 | $97,480 | $20,300 | $77,180 |
| 2021 | $6,012 | $97,480 | $20,300 | $77,180 |
| 2020 | $5,961 | $85,510 | $17,820 | $67,690 |
| 2019 | $5,786 | $244,300 | $50,900 | $193,400 |
| 2018 | $5,204 | $85,510 | $17,820 | $67,690 |
| 2017 | $5,253 | $79,180 | $16,070 | $63,110 |
| 2016 | $5,210 | $79,180 | $16,070 | $63,110 |
| 2015 | -- | $79,180 | $16,070 | $63,110 |
| 2014 | -- | $76,860 | $15,610 | $61,250 |
Source: Public Records
Map
Nearby Homes
- 8627 Courtland Dr
- 84 Sprague Rd
- 8036 Fair Rd
- 8902 Lincolnshire Blvd
- 104 Whitehall Dr
- 740 Fair St
- 243 Jananna Dr
- 9829 Plum Brook Ln
- 9598 Pebble Brook Ln
- 148 Meadow Cir
- 8746 Barton Dr
- 9401 Pheasant Run Place
- 22300 Rock Creek Cir
- 10353 Oak Branch Trail
- 0 Priem Rd
- 458 Sprague Rd
- 21355 Hickory Branch Trail
- 21176 Hickory Branch Trail
- 9384 N Marks Rd
- 74 Aaron St
- 21284 Montclare Blvd
- 21380 Montclare Blvd
- 21236 Montclare Blvd
- 21481 Montclare Blvd
- 21476 Montclare Blvd
- 21529 Montclare Blvd
- 21188 Montclare Blvd
- 21059 Montclare Blvd
- 8619 Courtland Dr
- 21573 Montclare Blvd
- 8568 Fair Rd
- 20987 Montclare Blvd
- 8576 Fair Rd
- 8584 Fair Rd
- 8536 Fair Rd
- 21572 Montclare Blvd
- 8633 Courtland Dr
- 21140 Montclare Blvd
- 8586 Fair Rd
- 8637 Courtland Dr