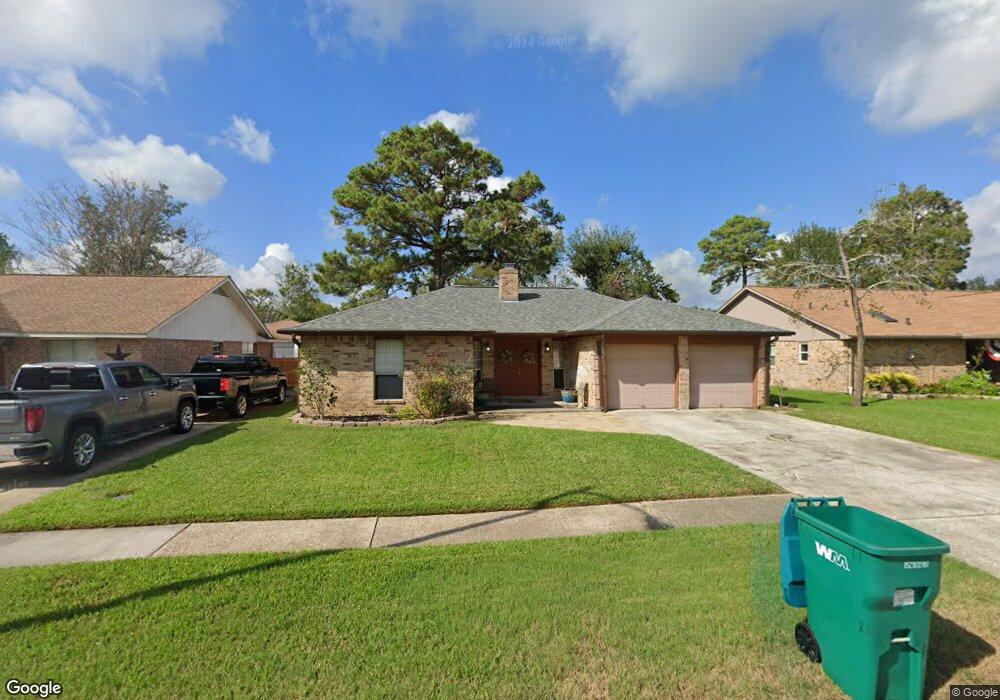
21335 Glenbranch Dr Spring, TX 77388
Estimated Value: $231,000 - $246,000
3
Beds
2
Baths
1,517
Sq Ft
$156/Sq Ft
Est. Value
About This Home
This home is located at 21335 Glenbranch Dr, Spring, TX 77388 and is currently estimated at $236,219, approximately $155 per square foot. 21335 Glenbranch Dr is a home located in Harris County with nearby schools including Kreinhop Elementary School, Schindewolf Intermediate School, and Klein Collins High School.
Ownership History
Date
Name
Owned For
Owner Type
Purchase Details
Closed on
Nov 29, 2018
Sold by
Permenter Mark and Estate Of Anita Permenter
Bought by
Wistinghause Katie Jo
Current Estimated Value
Home Financials for this Owner
Home Financials are based on the most recent Mortgage that was taken out on this home.
Original Mortgage
$80,000
Outstanding Balance
$70,482
Interest Rate
4.8%
Mortgage Type
New Conventional
Estimated Equity
$165,737
Purchase Details
Closed on
Apr 27, 2000
Sold by
Hahn James Moss and Hahn Jamie Eileen
Bought by
Permenter Anita
Purchase Details
Closed on
Sep 29, 1995
Sold by
Hahn George A
Bought by
Hahn James Moss
Home Financials for this Owner
Home Financials are based on the most recent Mortgage that was taken out on this home.
Original Mortgage
$56,700
Interest Rate
7.88%
Create a Home Valuation Report for This Property
The Home Valuation Report is an in-depth analysis detailing your home's value as well as a comparison with similar homes in the area
Home Values in the Area
Average Home Value in this Area
Purchase History
| Date | Buyer | Sale Price | Title Company |
|---|---|---|---|
| Wistinghause Katie Jo | -- | None Available | |
| Permenter Anita | -- | Stewart Title | |
| Hahn James Moss | -- | Heritage Title Company |
Source: Public Records
Mortgage History
| Date | Status | Borrower | Loan Amount |
|---|---|---|---|
| Open | Wistinghause Katie Jo | $80,000 | |
| Previous Owner | Hahn James Moss | $56,700 |
Source: Public Records
Tax History Compared to Growth
Tax History
| Year | Tax Paid | Tax Assessment Tax Assessment Total Assessment is a certain percentage of the fair market value that is determined by local assessors to be the total taxable value of land and additions on the property. | Land | Improvement |
|---|---|---|---|---|
| 2025 | $3,828 | $218,846 | $49,997 | $168,849 |
| 2024 | $3,828 | $227,608 | $49,997 | $177,611 |
| 2023 | $3,828 | $230,837 | $49,997 | $180,840 |
| 2022 | $4,828 | $202,122 | $49,997 | $152,125 |
| 2021 | $4,704 | $167,740 | $29,165 | $138,575 |
| 2020 | $4,486 | $153,964 | $29,165 | $124,799 |
| 2019 | $4,717 | $155,930 | $29,165 | $126,765 |
| 2018 | $492 | $128,547 | $22,915 | $105,632 |
| 2017 | $3,543 | $128,547 | $22,915 | $105,632 |
| 2016 | $3,221 | $126,831 | $22,915 | $103,916 |
| 2015 | $1,147 | $126,831 | $22,915 | $103,916 |
| 2014 | $1,147 | $99,996 | $17,499 | $82,497 |
Source: Public Records
Map
Nearby Homes
- 21418 Bassbrook Dr
- 21514 Greenham Dr
- 3315 Mourning Dove Dr
- 3326 Hartfield Ln
- 21311 Golden Dove Dr
- 3327 Keygate Dr
- 21603 Meadowhill Dr
- 3406 Hartfield Ln
- 21707 Glenbranch Dr
- 3402 Haydee Rd
- 21323 Deerhaven Dr
- 21303 Deerhaven Dr
- 21710 Rotherham Dr
- 3206 Watercliff Ct
- 2527 Liza Ct
- 21323 Hannover Forest
- 21807 Glenbranch Dr
- 21531 Roseville Dr
- 3406 Meadowlark Ln
- 3403 Berry Grove Dr
- 21339 Glenbranch Dr
- 21331 Glenbranch Dr
- 21330 Greenham Dr
- 21343 Glenbranch Dr
- 21327 Glenbranch Dr
- 21334 Greenham Dr
- 21338 Greenham Dr
- 21322 Greenham Dr
- 21403 Glenbranch Dr
- 21323 Glenbranch Dr
- 21334 Glenbranch Dr
- 21338 Glenbranch Dr
- 21330 Glenbranch Dr
- 21402 Greenham Dr
- 21342 Glenbranch Dr
- 21326 Glenbranch Dr
- 21318 Greenham Dr
- 21407 Glenbranch Dr
- 21319 Glenbranch Dr
- 21402 Glenbranch Dr