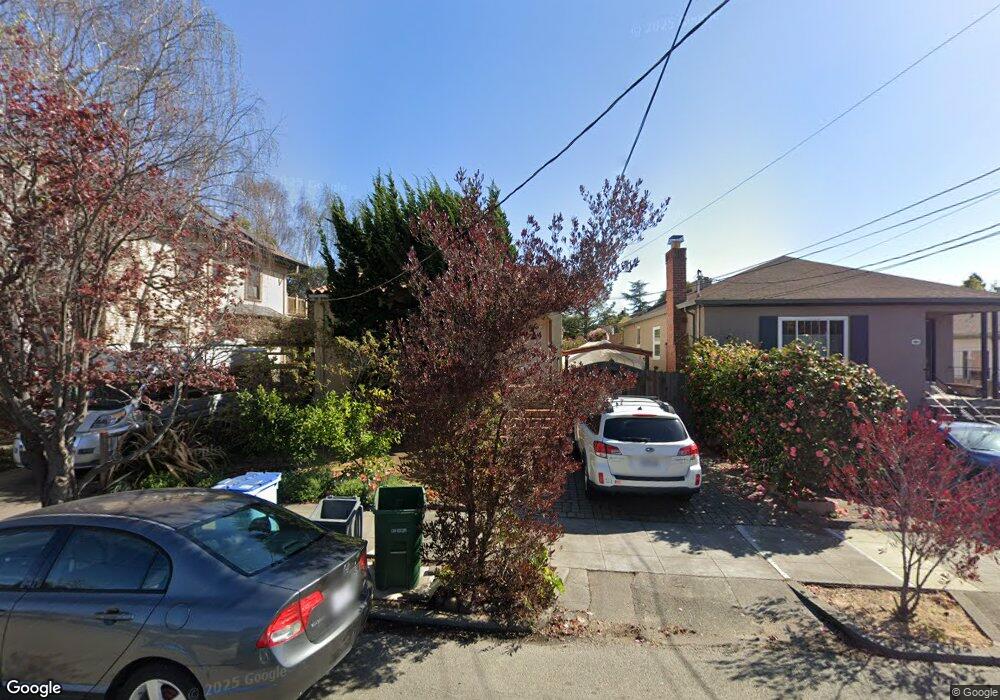
2134 Carleton St Berkeley, CA 94704
South Berkeley NeighborhoodEstimated Value: $1,023,000 - $1,463,000
2
Beds
1
Bath
1,127
Sq Ft
$1,023/Sq Ft
Est. Value
About This Home
This home is located at 2134 Carleton St, Berkeley, CA 94704 and is currently estimated at $1,152,968, approximately $1,023 per square foot. 2134 Carleton St is a home located in Alameda County with nearby schools including Malcolm X Elementary School, Emerson Elementary School, and John Muir Elementary School.
Ownership History
Date
Name
Owned For
Owner Type
Purchase Details
Closed on
Sep 4, 2012
Sold by
Pertschuk Mark A and Pertschuk Karen
Bought by
Pertschuk Mark A and Pertschuk Karen
Current Estimated Value
Purchase Details
Closed on
Nov 1, 2007
Sold by
Pertschuk Mark A and Pertschuk Karen
Bought by
Pertschuk Mark A and Pertschuk Karen
Purchase Details
Closed on
Nov 2, 1993
Sold by
Gross Robert and Estate Of Irene Gross
Bought by
Pertschuk Mark A and Pertschuk Karen J
Home Financials for this Owner
Home Financials are based on the most recent Mortgage that was taken out on this home.
Original Mortgage
$183,200
Interest Rate
6.97%
Create a Home Valuation Report for This Property
The Home Valuation Report is an in-depth analysis detailing your home's value as well as a comparison with similar homes in the area
Home Values in the Area
Average Home Value in this Area
Purchase History
| Date | Buyer | Sale Price | Title Company |
|---|---|---|---|
| Pertschuk Mark A | -- | First American Title Ins Co | |
| Pertschuk Mark A | -- | None Available | |
| Pertschuk Mark A | $229,000 | Placer Title Company |
Source: Public Records
Mortgage History
| Date | Status | Borrower | Loan Amount |
|---|---|---|---|
| Closed | Pertschuk Mark A | $183,200 |
Source: Public Records
Tax History
| Year | Tax Paid | Tax Assessment Tax Assessment Total Assessment is a certain percentage of the fair market value that is determined by local assessors to be the total taxable value of land and additions on the property. | Land | Improvement |
|---|---|---|---|---|
| 2025 | $7,407 | $382,207 | $116,762 | $272,445 |
| 2024 | $7,407 | $374,577 | $114,473 | $267,104 |
| 2023 | $7,179 | $374,096 | $112,229 | $261,867 |
| 2022 | $6,960 | $359,761 | $110,028 | $256,733 |
| 2021 | $6,956 | $352,570 | $107,871 | $251,699 |
| 2020 | $6,550 | $355,884 | $106,765 | $249,119 |
| 2019 | $6,248 | $348,906 | $104,672 | $244,234 |
| 2018 | $6,121 | $342,065 | $102,619 | $239,446 |
| 2017 | $5,884 | $335,360 | $100,608 | $234,752 |
| 2016 | $5,652 | $328,786 | $98,636 | $230,150 |
| 2015 | $5,566 | $323,848 | $97,154 | $226,694 |
| 2014 | $5,505 | $317,505 | $95,251 | $222,254 |
Source: Public Records
Map
Nearby Homes
- 2319 Ward St
- 2018 Blake St
- 2702 Dana St
- 2550 Dana St Unit 2F
- 2923 Wheeler St
- 1901 Parker St Unit 3
- 2243 Ashby Ave
- 2535 Chilton Way
- 2110 Ashby Ave
- 2917 Telegraph Ave
- 2057 Emerson St
- 2701 Grant St
- 3046 Deakin St
- 2935 Florence St
- 2509 Dwight Way
- 2124 Prince St
- 2926 Ellis St
- 2643 Stuart St
- 629 66th St
- 1645 Dwight Way
- 2130 Carleton St
- 2138 Carleton St
- 2128 Carleton St
- 2634 Fulton St
- 2630 Fulton St
- 2122 Carleton St
- 2140 Carleton St
- 2638 Fulton St
- 2139 Derby St
- 2135 Derby St
- 2120 Carleton St
- 2133.5 Derby St
- 2133 Derby St
- 2133 Derby St
- 2145 Derby St
- 2642 Fulton St
- 2131 Derby St
- 2118 Carleton St
- 2133B Derby St
- 2127 Derby St
Your Personal Tour Guide
Ask me questions while you tour the home.