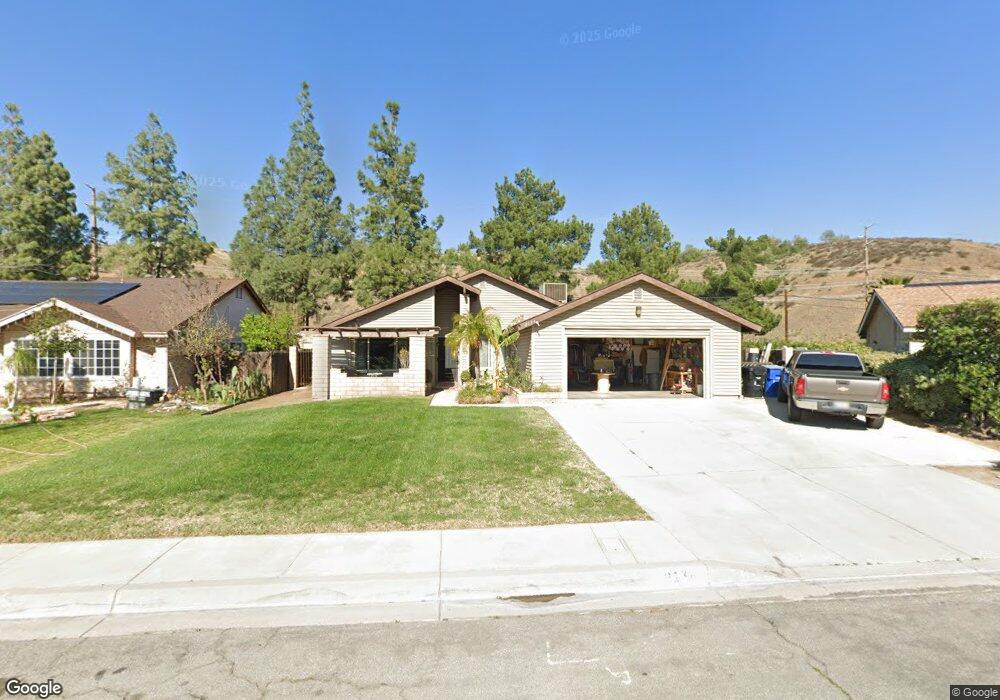
2134 Sheridan Rd San Bernardino, CA 92407
Kendall NeighborhoodEstimated Value: $505,153 - $558,000
3
Beds
2
Baths
1,440
Sq Ft
$370/Sq Ft
Est. Value
About This Home
This home is located at 2134 Sheridan Rd, San Bernardino, CA 92407 and is currently estimated at $532,288, approximately $369 per square foot. 2134 Sheridan Rd is a home located in San Bernardino County with nearby schools including Kendall Elementary School, Shandin Hills Middle School, and Cajon High School.
Ownership History
Date
Name
Owned For
Owner Type
Purchase Details
Closed on
Jul 5, 2006
Sold by
Va
Bought by
Garcia Hector M and Garcia Herminia T
Current Estimated Value
Home Financials for this Owner
Home Financials are based on the most recent Mortgage that was taken out on this home.
Original Mortgage
$252,683
Outstanding Balance
$151,826
Interest Rate
6.87%
Mortgage Type
Purchase Money Mortgage
Estimated Equity
$380,462
Purchase Details
Closed on
Oct 12, 1994
Sold by
Klug Jeffrey R and Klug Kimberlee Anne
Bought by
Va
Purchase Details
Closed on
Oct 27, 1993
Sold by
Klug Jeffrey R
Bought by
Klug Jeffrey R and Klug Kimberlee Anne
Home Financials for this Owner
Home Financials are based on the most recent Mortgage that was taken out on this home.
Original Mortgage
$104,000
Interest Rate
7.2%
Create a Home Valuation Report for This Property
The Home Valuation Report is an in-depth analysis detailing your home's value as well as a comparison with similar homes in the area
Home Values in the Area
Average Home Value in this Area
Purchase History
| Date | Buyer | Sale Price | Title Company |
|---|---|---|---|
| Garcia Hector M | -- | First American Title Company | |
| Va | $104,500 | Continental Lawyers Title Co | |
| Klug Jeffrey R | -- | Fidelity National Title Insu |
Source: Public Records
Mortgage History
| Date | Status | Borrower | Loan Amount |
|---|---|---|---|
| Open | Garcia Hector M | $252,683 | |
| Previous Owner | Klug Jeffrey R | $104,000 |
Source: Public Records
Tax History Compared to Growth
Tax History
| Year | Tax Paid | Tax Assessment Tax Assessment Total Assessment is a certain percentage of the fair market value that is determined by local assessors to be the total taxable value of land and additions on the property. | Land | Improvement |
|---|---|---|---|---|
| 2025 | $2,266 | $175,527 | $43,842 | $131,685 |
| 2024 | $2,266 | $172,085 | $42,982 | $129,103 |
| 2023 | $2,209 | $168,711 | $42,139 | $126,572 |
| 2022 | $2,208 | $165,403 | $41,313 | $124,090 |
| 2021 | $2,208 | $162,160 | $40,503 | $121,657 |
| 2020 | $2,211 | $160,498 | $40,088 | $120,410 |
| 2019 | $2,147 | $157,351 | $39,302 | $118,049 |
| 2018 | $2,123 | $154,265 | $38,531 | $115,734 |
| 2017 | $2,057 | $151,240 | $37,775 | $113,465 |
| 2016 | $1,995 | $148,274 | $37,034 | $111,240 |
| 2015 | $1,878 | $146,047 | $36,478 | $109,569 |
| 2014 | $1,825 | $143,186 | $35,763 | $107,423 |
Source: Public Records
Map
Nearby Homes
- 1805 Clemson St
- 5641 N Pinnacle Ln
- 5305 Lilac St
- 1951 Provost Ct
- 5370 N Alumni Ln
- 4981 N State St
- 4872 Cambridge Ave
- 5615 Buckboard Dr
- 10 Kendall Dr
- 2652 Shadow Hills Dr
- 1559 Wild Pony Path
- 2660 Twain Dr Unit 15
- 1535 Sheridan Rd
- 2664 W White Pine Ave
- 1527 Kendall Dr
- 1503 Indian Trail
- 2695 Rosarita St
- 1548 Teton St
- 5205 N Mammoth Dr
- 2724 June Place
- 2144 Sheridan Rd
- 2124 Sheridan Rd
- 2154 Sheridan Rd
- 2114 Sheridan Rd
- 2137 Sheridan Rd
- 2115 Sheridan Rd
- 5477 Jasmine St
- 2164 Sheridan Rd
- 2127 Sheridan Rd
- 5459 Jasmine St
- 2174 Sheridan Rd
- 5354 Revere Ave
- 5264 Notnil Ct
- 5318 Revere Ave
- 5458 Jasmine St
- 5270 Notnil Ct
- 5441 Jasmine St
- 5256 Notnil Ct
- 5376 Revere Ave
- 2184 Sheridan Rd