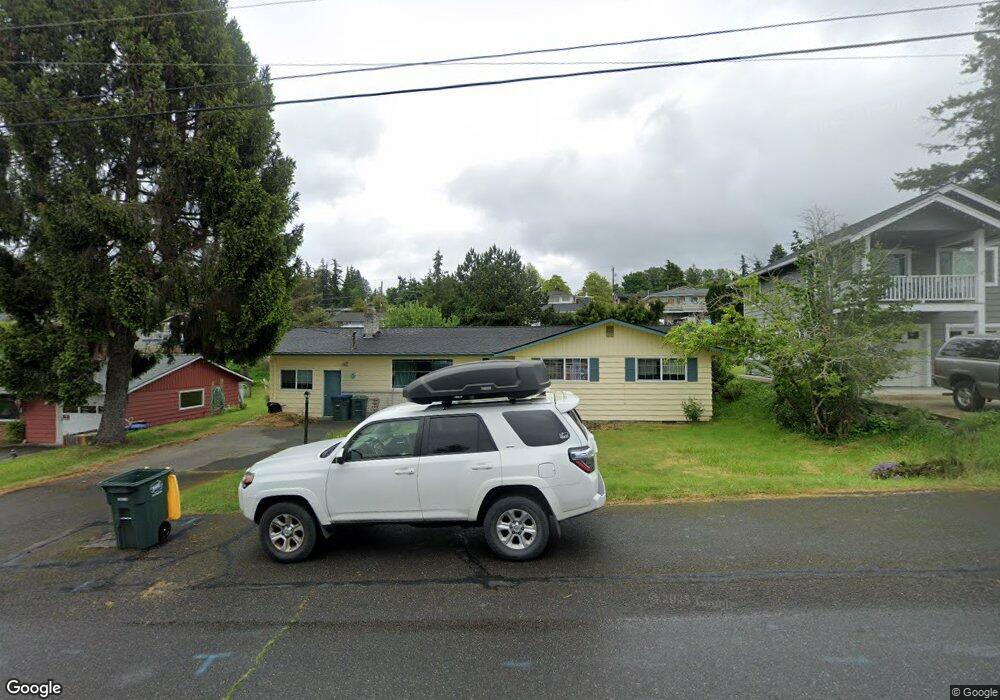
2134 St Clair St Bellingham, WA 98229
Alabama Hill NeighborhoodEstimated Value: $601,000 - $685,000
3
Beds
1
Bath
1,512
Sq Ft
$422/Sq Ft
Est. Value
About This Home
This home is located at 2134 St Clair St, Bellingham, WA 98229 and is currently estimated at $637,398, approximately $421 per square foot. 2134 St Clair St is a home located in Whatcom County with nearby schools including Roosevelt Elementary School, Kulshan Middle School, and Bellingham High School.
Ownership History
Date
Name
Owned For
Owner Type
Purchase Details
Closed on
Sep 27, 2004
Sold by
Shupe David L
Bought by
Smith Dana C and Stefurak Robert E
Current Estimated Value
Home Financials for this Owner
Home Financials are based on the most recent Mortgage that was taken out on this home.
Original Mortgage
$230,000
Outstanding Balance
$113,831
Interest Rate
5.76%
Mortgage Type
Purchase Money Mortgage
Estimated Equity
$523,567
Purchase Details
Closed on
Feb 23, 2001
Sold by
Shupe Georgia M
Bought by
Shupe David L
Home Financials for this Owner
Home Financials are based on the most recent Mortgage that was taken out on this home.
Original Mortgage
$119,850
Interest Rate
6.98%
Purchase Details
Closed on
Jul 19, 1999
Sold by
Gosda Jill Marie and Gosda Gregory S
Bought by
Shupe David L and Shupe Georgia M
Home Financials for this Owner
Home Financials are based on the most recent Mortgage that was taken out on this home.
Original Mortgage
$115,822
Interest Rate
7.64%
Mortgage Type
FHA
Create a Home Valuation Report for This Property
The Home Valuation Report is an in-depth analysis detailing your home's value as well as a comparison with similar homes in the area
Home Values in the Area
Average Home Value in this Area
Purchase History
| Date | Buyer | Sale Price | Title Company |
|---|---|---|---|
| Smith Dana C | $230,500 | Stewart Title Company | |
| Shupe David L | -- | Charter Title Corporation | |
| Shupe David L | $116,000 | Whatcom Land Title Company I |
Source: Public Records
Mortgage History
| Date | Status | Borrower | Loan Amount |
|---|---|---|---|
| Open | Smith Dana C | $230,000 | |
| Previous Owner | Shupe David L | $119,850 | |
| Previous Owner | Shupe David L | $115,822 |
Source: Public Records
Tax History Compared to Growth
Tax History
| Year | Tax Paid | Tax Assessment Tax Assessment Total Assessment is a certain percentage of the fair market value that is determined by local assessors to be the total taxable value of land and additions on the property. | Land | Improvement |
|---|---|---|---|---|
| 2024 | $4,418 | $543,628 | $231,228 | $312,400 |
| 2023 | $4,418 | $567,532 | $241,395 | $326,137 |
| 2022 | $3,822 | $497,835 | $211,750 | $286,085 |
| 2021 | $3,079 | $411,434 | $175,000 | $236,434 |
| 2020 | $2,977 | $312,862 | $140,193 | $172,669 |
| 2019 | $2,663 | $292,348 | $131,085 | $161,263 |
| 2018 | $2,756 | $262,221 | $117,585 | $144,636 |
| 2017 | $2,397 | $232,015 | $104,040 | $127,975 |
| 2016 | $2,193 | $210,905 | $94,680 | $116,225 |
| 2015 | $2,069 | $200,849 | $90,000 | $110,849 |
| 2014 | -- | $183,368 | $72,240 | $111,128 |
| 2013 | -- | $175,811 | $70,000 | $105,811 |
Source: Public Records
Map
Nearby Homes
- 2341 Michigan St
- 2126 Zephyr Place
- 2218 Niagara Dr
- 2316 Xenia St
- 950 Yew St
- 2603 Huron St
- 2321 Crestline Dr
- 2330 Verona St
- 2639 Yew St
- 2104 Birch Cir Unit 5C
- 2617 Woburn St
- 2615 Woburn St
- 2619 Woburn St
- 3104 E Maryland St
- 2178 E Birch St Unit 7A
- 2612 Birch St
- 3700 Alabama St Unit 316
- 2620 Birch St
- 1515 Woburn St
- 1813 Undine Ln
- 2140 St Clair St
- 2128 St Clair St
- 2135 Huron St
- 2141 Huron St
- 2129 Huron St
- 2146 St Clair St
- 2122 St Clair St
- 2145 Huron St
- 2119 Huron St
- 2141 St Clair St
- 2129 St Clair St
- 2200 St Clair St
- 2116 St Clair St
- 2143 St Clair St
- 2123 St Clair St
- 2209 Huron St
- 2115 Huron St
- 2207 St Clair St
- 2210 St Clair St