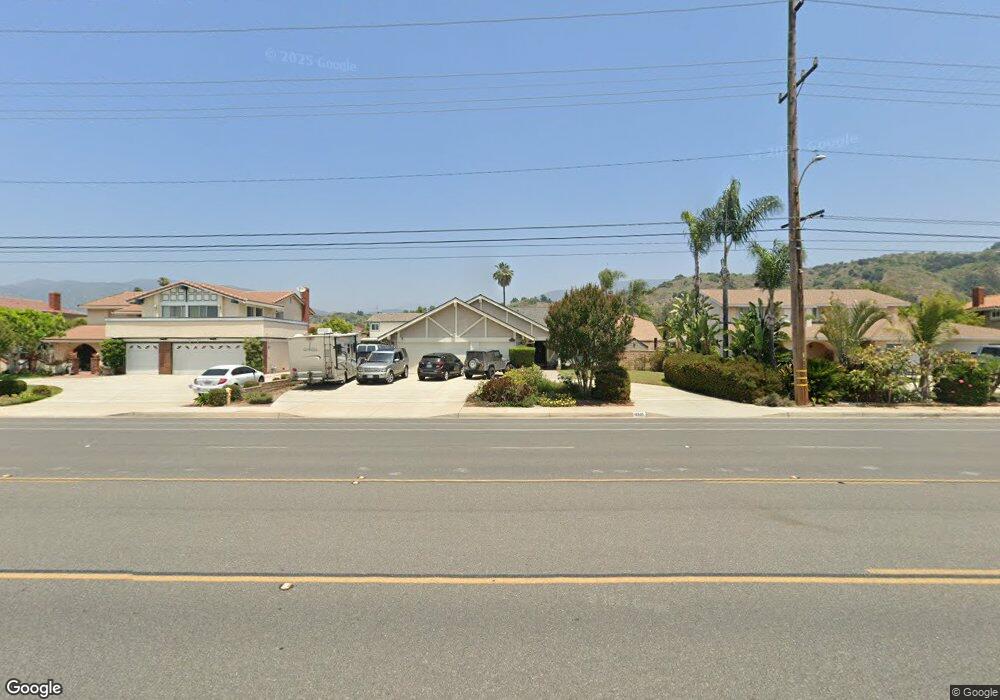
2135 Baseline Rd La Verne, CA 91750
North La Verne NeighborhoodEstimated Value: $984,171 - $1,029,000
3
Beds
2
Baths
1,570
Sq Ft
$639/Sq Ft
Est. Value
About This Home
This home is located at 2135 Baseline Rd, La Verne, CA 91750 and is currently estimated at $1,003,793, approximately $639 per square foot. 2135 Baseline Rd is a home located in Los Angeles County with nearby schools including La Verne Heights Elementary School, Ramona Middle School, and Bonita High School.
Ownership History
Date
Name
Owned For
Owner Type
Purchase Details
Closed on
May 20, 2025
Sold by
Aque Jonn and Aque Tami
Bought by
Aque Family Trust and Aque
Current Estimated Value
Home Financials for this Owner
Home Financials are based on the most recent Mortgage that was taken out on this home.
Original Mortgage
$301,500
Outstanding Balance
$299,116
Interest Rate
6.83%
Mortgage Type
New Conventional
Estimated Equity
$704,677
Purchase Details
Closed on
Feb 1, 2025
Sold by
Aque Christine
Bought by
Aque Family Trust and Aque
Purchase Details
Closed on
Jun 5, 2024
Sold by
Aque Jonn and Aque Tami
Bought by
Aque Family Trust and Aque
Purchase Details
Closed on
May 17, 2024
Sold by
Aque Jonn and Aque Tami
Bought by
Aque Family Trust and Aque
Purchase Details
Closed on
Oct 13, 2004
Sold by
Aque Jonn
Bought by
Aque Jonn and Aque Tami
Home Financials for this Owner
Home Financials are based on the most recent Mortgage that was taken out on this home.
Original Mortgage
$422,500
Interest Rate
4%
Mortgage Type
New Conventional
Purchase Details
Closed on
Feb 26, 2004
Sold by
Aque Christine
Bought by
Aque John and Padilla Tami
Home Financials for this Owner
Home Financials are based on the most recent Mortgage that was taken out on this home.
Original Mortgage
$271,000
Interest Rate
5.64%
Mortgage Type
New Conventional
Purchase Details
Closed on
Jul 31, 2002
Sold by
Ghanam Ahmad
Bought by
Aque John A and Aque Christine
Home Financials for this Owner
Home Financials are based on the most recent Mortgage that was taken out on this home.
Original Mortgage
$268,000
Interest Rate
6.16%
Purchase Details
Closed on
Jul 26, 2001
Sold by
Ghannam Fayz
Bought by
Ghanam Ahmad
Purchase Details
Closed on
Apr 2, 2001
Sold by
Ghanan Ahmad
Bought by
Ghanan Fayz
Purchase Details
Closed on
Feb 15, 2000
Sold by
Kanimian Ovsep
Bought by
Ghanan Ahmad
Home Financials for this Owner
Home Financials are based on the most recent Mortgage that was taken out on this home.
Original Mortgage
$165,900
Interest Rate
8.21%
Mortgage Type
Stand Alone First
Create a Home Valuation Report for This Property
The Home Valuation Report is an in-depth analysis detailing your home's value as well as a comparison with similar homes in the area
Home Values in the Area
Average Home Value in this Area
Purchase History
| Date | Buyer | Sale Price | Title Company |
|---|---|---|---|
| Aque Family Trust | -- | None Listed On Document | |
| Aque Jonn | -- | None Listed On Document | |
| Aque Family Trust | -- | None Listed On Document | |
| Aque Family Trust | -- | None Listed On Document | |
| Aque Jonn | -- | None Listed On Document | |
| Aque Family Trust | -- | None Listed On Document | |
| Aque Jonn | -- | None Listed On Document | |
| Aque Jonn | -- | Security Union Title | |
| Aque John | -- | United Title Company | |
| Aque John A | $335,000 | Fidelity National Title Co | |
| Ghanam Ahmad | -- | -- | |
| Ghanan Fayz | -- | Southland Title | |
| Ghanan Ahmad | $237,000 | First American Title Co |
Source: Public Records
Mortgage History
| Date | Status | Borrower | Loan Amount |
|---|---|---|---|
| Open | Aque Jonn | $301,500 | |
| Previous Owner | Aque Jonn | $422,500 | |
| Previous Owner | Aque John | $271,000 | |
| Previous Owner | Aque John A | $268,000 | |
| Previous Owner | Ghanan Ahmad | $165,900 | |
| Closed | Ghanan Ahmad | $47,400 |
Source: Public Records
Tax History Compared to Growth
Tax History
| Year | Tax Paid | Tax Assessment Tax Assessment Total Assessment is a certain percentage of the fair market value that is determined by local assessors to be the total taxable value of land and additions on the property. | Land | Improvement |
|---|---|---|---|---|
| 2025 | $5,814 | $485,172 | $290,961 | $194,211 |
| 2024 | $5,814 | $475,659 | $285,256 | $190,403 |
| 2023 | $5,685 | $466,333 | $279,663 | $186,670 |
| 2022 | $5,593 | $457,190 | $274,180 | $183,010 |
| 2021 | $5,487 | $448,226 | $268,804 | $179,422 |
| 2019 | $5,379 | $434,933 | $260,832 | $174,101 |
| 2018 | $5,026 | $426,406 | $255,718 | $170,688 |
| 2016 | $4,835 | $409,850 | $245,789 | $164,061 |
| 2015 | $4,754 | $403,695 | $242,098 | $161,597 |
| 2014 | $4,706 | $395,788 | $237,356 | $158,432 |
Source: Public Records
Map
Nearby Homes
- 4700 Emerald Ave
- 1937 Citruswood St
- 4095 Fruit St Unit Spc 328
- 4095 Fruit St Unit 613
- 4095 Fruit St Unit 606
- 4095 Fruit St Unit 108
- 4095 Fruit St Unit 603
- 4095 Fruit St Unit 743
- 4095 Fruit St Unit 607
- 2516 Baseline Rd
- 521 Baseline Rd
- 3888 Chelsea Dr
- 1753 Eaton Place
- 1638 Larch Place
- 3788 Verdana Cir
- 3810 Abbey Way
- 0 Broken Spur Rd
- 350 Roughrider Rd
- 4485 Broken Spur Rd
- 1907 Canopy Ln
- 2143 Baseline Rd
- 2127 Baseline Rd
- 2140 Virginia Ave
- 2132 Virginia Ave
- 2151 Baseline Rd
- 2119 Baseline Rd
- 2148 Virginia Ave
- 2124 Virginia Ave
- 2172 Baseline Rd
- 2156 Virginia Ave
- 2160 Baseline Rd
- 2116 Virginia Ave
- 2184 Baseline Rd
- 2159 Baseline Rd
- 2111 Baseline Rd
- 2148 Baseline Rd
- 2196 Baseline Rd
- 2164 Virginia Ave
- 2108 Virginia Ave
- 2131 Virginia Ave