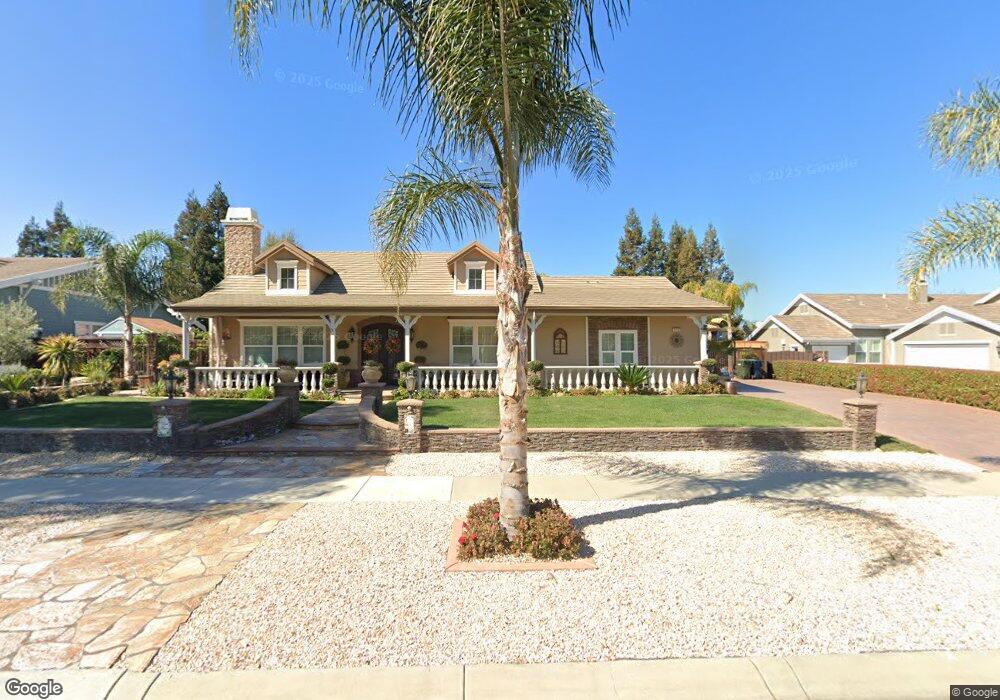
2135 Calibria Ct Livermore, CA 94550
Vinsanto NeighborhoodEstimated Value: $2,277,000 - $2,492,000
4
Beds
4
Baths
3,732
Sq Ft
$641/Sq Ft
Est. Value
About This Home
This home is located at 2135 Calibria Ct, Livermore, CA 94550 and is currently estimated at $2,393,013, approximately $641 per square foot. 2135 Calibria Ct is a home located in Alameda County with nearby schools including William Mendenhall Middle School, Granada High School, and Our Savior Lutheran.
Ownership History
Date
Name
Owned For
Owner Type
Purchase Details
Closed on
Sep 10, 2009
Sold by
Nguyen Han C
Bought by
Brum Paul R and Brum Evelyn
Current Estimated Value
Home Financials for this Owner
Home Financials are based on the most recent Mortgage that was taken out on this home.
Original Mortgage
$675,000
Outstanding Balance
$441,672
Interest Rate
5.2%
Mortgage Type
New Conventional
Estimated Equity
$1,951,341
Purchase Details
Closed on
Oct 14, 2008
Sold by
Nguyen Diem T
Bought by
Nguyen Han C
Purchase Details
Closed on
May 27, 2004
Sold by
Blossom Valley Investors Inc
Bought by
Nguyen Han C and Nguyen Diem T
Home Financials for this Owner
Home Financials are based on the most recent Mortgage that was taken out on this home.
Original Mortgage
$937,500
Interest Rate
6.87%
Mortgage Type
New Conventional
Create a Home Valuation Report for This Property
The Home Valuation Report is an in-depth analysis detailing your home's value as well as a comparison with similar homes in the area
Home Values in the Area
Average Home Value in this Area
Purchase History
| Date | Buyer | Sale Price | Title Company |
|---|---|---|---|
| Brum Paul R | $900,000 | Old Republic Title Company | |
| Nguyen Han C | -- | None Available | |
| Nguyen Han C | $1,270,000 | First Amer Title Guaranty Co |
Source: Public Records
Mortgage History
| Date | Status | Borrower | Loan Amount |
|---|---|---|---|
| Open | Brum Paul R | $675,000 | |
| Previous Owner | Nguyen Han C | $937,500 |
Source: Public Records
Tax History Compared to Growth
Tax History
| Year | Tax Paid | Tax Assessment Tax Assessment Total Assessment is a certain percentage of the fair market value that is determined by local assessors to be the total taxable value of land and additions on the property. | Land | Improvement |
|---|---|---|---|---|
| 2025 | $14,717 | $1,207,533 | $348,497 | $866,036 |
| 2024 | $14,717 | $1,183,726 | $341,666 | $849,060 |
| 2023 | $14,514 | $1,167,381 | $334,967 | $832,414 |
| 2022 | $14,314 | $1,137,497 | $328,401 | $816,096 |
| 2021 | $13,443 | $1,115,064 | $321,964 | $800,100 |
| 2020 | $13,754 | $1,110,564 | $318,664 | $791,900 |
| 2019 | $13,862 | $1,088,792 | $312,417 | $776,375 |
| 2018 | $13,585 | $1,067,450 | $306,293 | $761,157 |
| 2017 | $13,236 | $1,046,523 | $300,288 | $746,235 |
| 2016 | $12,807 | $1,026,010 | $294,402 | $731,608 |
| 2015 | $12,047 | $1,010,606 | $289,982 | $720,624 |
| 2014 | $11,847 | $990,817 | $284,304 | $706,513 |
Source: Public Records
Map
Nearby Homes
- 1324 Chateau Common Unit 206
- 1153 Sherry Way
- 1909 De Vaca Way
- 2323 Grosvenor Heights Ct Unit C
- 1004 Vienna St
- 2211 College Ave
- 1810 Peary Way
- 1467 Hudson Way
- 1348 Carlton Place
- 3732 Carrigan Common
- 3283 East Ave
- 2858 Superior Dr
- 1247 Columbus Ave
- 2470 Sheffield Dr
- 1110 Lomitas Ave
- 1734 Catalina Ct
- 2276 Stonebridge Rd
- 1623 4th St
- 2583 Regent Rd
- 967 Miranda Way
- 2087 Calibria Ct
- 2167 Calibria Ct
- 2788 Louvre Ln
- 2146 Calibria Ct
- 2055 Calibria Ct
- 2795 Vintage Ct
- 2150 Calibria Ct
- 2199 Calibria Ct
- 2725 Vine Dr
- 2702 Vine Dr
- 2178 Calibria Ct
- 2733 Vintage Ct
- 2033 Calibria Ct
- 2716 Vine Dr
- 2279 Montarossa Ct
- 2243 Montarossa Ct
- 2743 San Minete Dr
- 2758 Vintage Ct
- 2728 Vine Dr
- 2285 Montarossa Ct