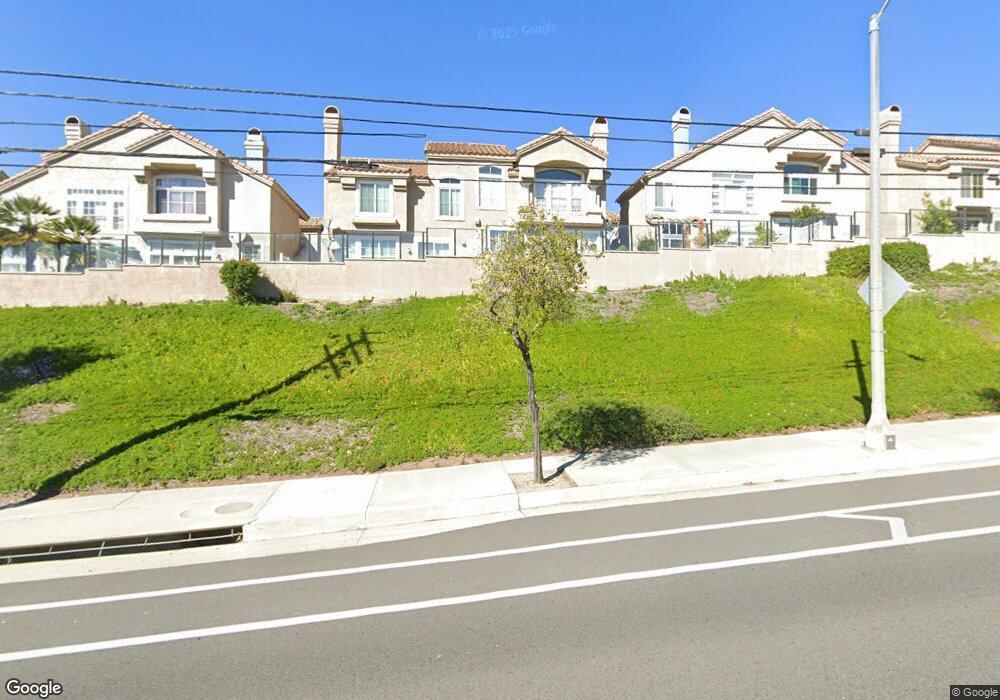
2135 Camellia Ln Fullerton, CA 92833
Coyote Hills NeighborhoodEstimated Value: $992,000 - $1,058,000
3
Beds
3
Baths
1,720
Sq Ft
$602/Sq Ft
Est. Value
About This Home
This home is located at 2135 Camellia Ln, Fullerton, CA 92833 and is currently estimated at $1,035,550, approximately $602 per square foot. 2135 Camellia Ln is a home located in Orange County with nearby schools including Charles G. Emery Elementary School, Buena Park Junior High School, and Sonora High School.
Ownership History
Date
Name
Owned For
Owner Type
Purchase Details
Closed on
Jan 24, 2026
Sold by
Cherukuri Krishna and Cherukuri Vidya
Bought by
Krishna & Vidya Cherukuri Family Trust and Cherukuri
Current Estimated Value
Purchase Details
Closed on
Jan 25, 2011
Sold by
Suluck Inc
Bought by
Cherukuri Krishna and Cherukuri Vidya
Home Financials for this Owner
Home Financials are based on the most recent Mortgage that was taken out on this home.
Original Mortgage
$417,000
Interest Rate
4.74%
Mortgage Type
New Conventional
Purchase Details
Closed on
Sep 17, 2010
Sold by
Pae Ok Hwa
Bought by
Suluck Inc
Purchase Details
Closed on
May 15, 2003
Sold by
Choe Young Min and Choe Hai Sook
Bought by
Pae Ok Hwa
Home Financials for this Owner
Home Financials are based on the most recent Mortgage that was taken out on this home.
Original Mortgage
$306,400
Interest Rate
5.25%
Mortgage Type
Purchase Money Mortgage
Purchase Details
Closed on
Aug 20, 1996
Sold by
Yakoob Wadalawala Muhamed and Ya Wadalawala Nafisa
Bought by
Choe Young Min and Choe Hai Sook
Home Financials for this Owner
Home Financials are based on the most recent Mortgage that was taken out on this home.
Original Mortgage
$142,500
Interest Rate
8.23%
Create a Home Valuation Report for This Property
The Home Valuation Report is an in-depth analysis detailing your home's value as well as a comparison with similar homes in the area
Home Values in the Area
Average Home Value in this Area
Purchase History
| Date | Buyer | Sale Price | Title Company |
|---|---|---|---|
| Krishna & Vidya Cherukuri Family Trust | -- | None Listed On Document | |
| Cherukuri Krishna | $470,000 | Advantage Title Inc | |
| Suluck Inc | $411,500 | None Available | |
| Pae Ok Hwa | $383,000 | Southland Title Company | |
| Choe Young Min | $190,000 | Stewart Title |
Source: Public Records
Mortgage History
| Date | Status | Borrower | Loan Amount |
|---|---|---|---|
| Previous Owner | Cherukuri Krishna | $417,000 | |
| Previous Owner | Pae Ok Hwa | $306,400 | |
| Previous Owner | Choe Young Min | $142,500 |
Source: Public Records
Tax History
| Year | Tax Paid | Tax Assessment Tax Assessment Total Assessment is a certain percentage of the fair market value that is determined by local assessors to be the total taxable value of land and additions on the property. | Land | Improvement |
|---|---|---|---|---|
| 2025 | $6,768 | $602,148 | $408,544 | $193,604 |
| 2024 | $6,768 | $590,342 | $400,534 | $189,808 |
| 2023 | $6,632 | $578,767 | $392,680 | $186,087 |
| 2022 | $6,527 | $567,419 | $384,980 | $182,439 |
| 2021 | $6,480 | $556,294 | $377,432 | $178,862 |
| 2020 | $6,400 | $550,590 | $373,562 | $177,028 |
| 2019 | $6,246 | $539,795 | $366,238 | $173,557 |
| 2018 | $6,125 | $529,211 | $359,057 | $170,154 |
| 2017 | $6,039 | $518,835 | $352,017 | $166,818 |
| 2016 | $5,919 | $508,662 | $345,114 | $163,548 |
| 2015 | $5,660 | $501,022 | $339,930 | $161,092 |
| 2014 | $5,645 | $491,208 | $333,271 | $157,937 |
Source: Public Records
Map
Nearby Homes
- 3001 Wisteria Ln
- 2111 Cheyenne Way Unit 5
- 3110 Cochise Way Unit 88
- 8697 Hillcrest Rd
- 2833 Muir Trail Dr
- 2951 Hawks Pointe Ct
- 4840 Sunnybrook Ave
- 4751 Saint Andrews Ave
- 4733 Durango Dr
- 15819 Rosalita Dr
- 15794 Stanbrook Dr
- 14604 Balin Place
- 13819 Visions Dr
- 1715 Fairford Dr
- 8135 Keith Green
- 14006 Las Puertas St
- 2505 Regency Cir
- 15942 Alta Vista Dr Unit D
- 15736 Hesse Dr
- 16323 Alpine Place
- 2139 Camellia Ln
- 2127 Camellia Ln
- 2123 Camellia Ln Unit 36
- 2147 Camellia Ln
- 2151 Camellia Ln
- 2132 Camellia Ln
- 2115 Camellia Ln Unit 37
- 2136 Camellia Ln
- 2120 Camellia Ln Unit 70
- 2120 Camellia Ln
- 2159 Camellia Ln Unit 30
- 2916 Wisteria Ln
- 3065 Primrose Ln
- 3077 Primrose Ln Unit 25
- 2112 Camellia Ln
- 2163 Camellia Ln
- 3061 Primrose Ln
- 3073 Primrose Ln
- 2156 Camellia Ln
- 3085 Primrose Ln
Your Personal Tour Guide
Ask me questions while you tour the home.