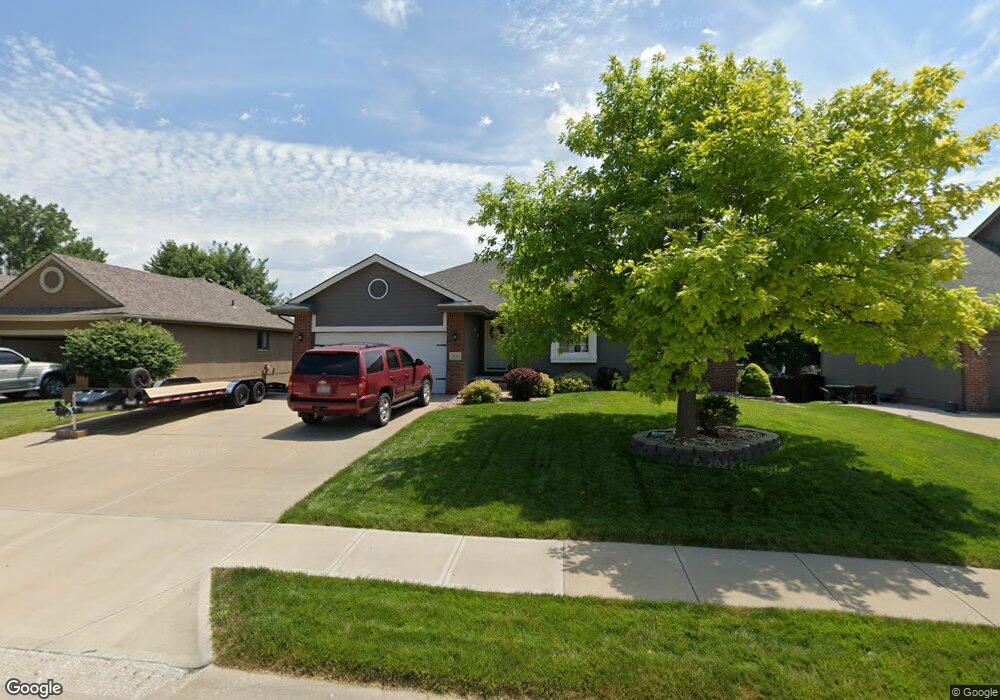
2135 Cobblestone Rd Papillion, NE 68133
Estimated Value: $360,000 - $389,000
3
Beds
2
Baths
1,482
Sq Ft
$253/Sq Ft
Est. Value
About This Home
This home is located at 2135 Cobblestone Rd, Papillion, NE 68133 and is currently estimated at $374,320, approximately $252 per square foot. 2135 Cobblestone Rd is a home located in Sarpy County with nearby schools including Rumsey Station Elementary School, La Vista Middle School, and Papillion La Vista Senior High School.
Ownership History
Date
Name
Owned For
Owner Type
Purchase Details
Closed on
Aug 10, 2023
Sold by
Narak Karri
Bought by
Narak Stephen
Current Estimated Value
Purchase Details
Closed on
Apr 26, 1999
Sold by
Pacesetter Homes Inc
Bought by
Narak Stephen and Narak Karri L
Home Financials for this Owner
Home Financials are based on the most recent Mortgage that was taken out on this home.
Original Mortgage
$110,000
Interest Rate
7.07%
Purchase Details
Closed on
Nov 10, 1998
Sold by
Eagle Ridge Development Company
Bought by
Pacesetter Homes Inc
Create a Home Valuation Report for This Property
The Home Valuation Report is an in-depth analysis detailing your home's value as well as a comparison with similar homes in the area
Home Values in the Area
Average Home Value in this Area
Purchase History
| Date | Buyer | Sale Price | Title Company |
|---|---|---|---|
| Narak Stephen | -- | None Listed On Document | |
| Narak Stephen | $151,000 | -- | |
| Pacesetter Homes Inc | $22,000 | -- |
Source: Public Records
Mortgage History
| Date | Status | Borrower | Loan Amount |
|---|---|---|---|
| Previous Owner | Narak Stephen | $110,000 |
Source: Public Records
Tax History Compared to Growth
Tax History
| Year | Tax Paid | Tax Assessment Tax Assessment Total Assessment is a certain percentage of the fair market value that is determined by local assessors to be the total taxable value of land and additions on the property. | Land | Improvement |
|---|---|---|---|---|
| 2025 | $5,340 | $361,370 | $55,000 | $306,370 |
| 2024 | $5,896 | $355,747 | $55,000 | $300,747 |
| 2023 | $5,896 | $313,127 | $48,000 | $265,127 |
| 2022 | $5,839 | $286,149 | $42,000 | $244,149 |
| 2021 | $5,424 | $260,545 | $42,000 | $218,545 |
| 2020 | $5,239 | $249,168 | $36,000 | $213,168 |
| 2019 | $5,176 | $246,317 | $36,000 | $210,317 |
| 2018 | $5,307 | $231,982 | $36,000 | $195,982 |
| 2017 | $5,111 | $223,538 | $26,000 | $197,538 |
| 2016 | $4,942 | $215,754 | $26,000 | $189,754 |
| 2015 | $4,915 | $214,446 | $26,000 | $188,446 |
| 2014 | $4,881 | $207,833 | $26,000 | $181,833 |
| 2012 | -- | $207,829 | $26,000 | $181,829 |
Source: Public Records
Map
Nearby Homes
- 2124 Betsy Ave
- 2001 Liberty Ln
- 1912 Franklin Dr
- 109 Summerset Cir
- 2115 Skyhawk Ave
- 401 Castle Pine Dr
- 205 Sea Pines Dr
- 207 Hilton Head Dr
- 217 Sumter Cir
- 2110 Aberdeen Plaza
- 206 Sumter Cir
- 209 Sea Pines Dr
- 605 Ruby Rd
- 1507 Charleston Dr
- 2207 Kara Dr
- 5903 Longview St
- 611 Rosewood Ave
- 923 Arlene Cir
- 2004 Longview St
- 703 Tupelo Ln
- 2133 Cobblestone Rd
- 2137 Cobblestone Rd
- 2134 Bear Creek Rd
- 2132 Bear Creek Rd
- 2131 Cobblestone Rd
- 2139 Cobblestone Rd
- 2136 Bear Creek Rd
- 2130 Bear Creek Rd
- 2136 Cobblestone Rd
- 2134 Cobblestone Rd
- 2138 Bear Creek Rd
- 2138 Cobblestone Rd
- 2129 Cobblestone Rd
- 2141 Cobblestone Rd
- 2132 Cobblestone Rd
- 2128 Bear Creek Rd
- 2140 Cobblestone Rd
- 2140 Bear Creek Rd
- 2130 Cobblestone Rd
- 2143 Cobblestone Rd