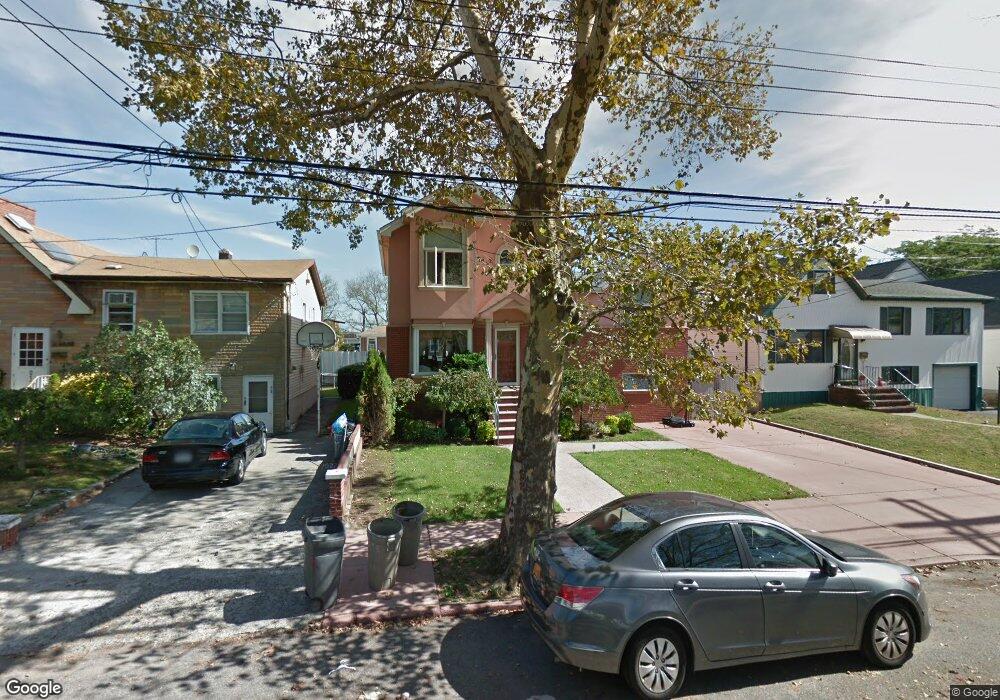
2135 E 65th St Brooklyn, NY 11234
Mill Basin NeighborhoodEstimated Value: $1,431,000 - $1,736,000
Studio
--
Bath
3,129
Sq Ft
$511/Sq Ft
Est. Value
About This Home
This home is located at 2135 E 65th St, Brooklyn, NY 11234 and is currently estimated at $1,599,677, approximately $511 per square foot. 2135 E 65th St is a home located in Kings County with nearby schools including P.S. 236 Mill Basin, James Madison High School, and Hebrew Language Academy.
Ownership History
Date
Name
Owned For
Owner Type
Purchase Details
Closed on
Dec 29, 2016
Sold by
Kraiem Hava
Bought by
Kraiem Hava
Current Estimated Value
Home Financials for this Owner
Home Financials are based on the most recent Mortgage that was taken out on this home.
Original Mortgage
$625,500
Outstanding Balance
$505,392
Interest Rate
3.54%
Mortgage Type
Purchase Money Mortgage
Estimated Equity
$1,094,285
Purchase Details
Closed on
Dec 8, 2016
Sold by
Rosenblatt Roberta
Bought by
Kraiem Hava and Kraiem Oren
Home Financials for this Owner
Home Financials are based on the most recent Mortgage that was taken out on this home.
Original Mortgage
$625,500
Outstanding Balance
$505,392
Interest Rate
3.54%
Mortgage Type
Purchase Money Mortgage
Estimated Equity
$1,094,285
Purchase Details
Closed on
Feb 6, 2001
Sold by
Kwak Young Boo
Bought by
Rosenblatt Roberta
Home Financials for this Owner
Home Financials are based on the most recent Mortgage that was taken out on this home.
Original Mortgage
$245,000
Interest Rate
6.62%
Create a Home Valuation Report for This Property
The Home Valuation Report is an in-depth analysis detailing your home's value as well as a comparison with similar homes in the area
Home Values in the Area
Average Home Value in this Area
Purchase History
| Date | Buyer | Sale Price | Title Company |
|---|---|---|---|
| Kraiem Hava | $550,000 | -- | |
| Kraiem Hava | $1,100,000 | -- | |
| Rosenblatt Roberta | $445,000 | Fidelity National Title Ins |
Source: Public Records
Mortgage History
| Date | Status | Borrower | Loan Amount |
|---|---|---|---|
| Open | Kraiem Hava | $625,500 | |
| Previous Owner | Rosenblatt Roberta | $245,000 |
Source: Public Records
Tax History
| Year | Tax Paid | Tax Assessment Tax Assessment Total Assessment is a certain percentage of the fair market value that is determined by local assessors to be the total taxable value of land and additions on the property. | Land | Improvement |
|---|---|---|---|---|
| 2025 | $13,913 | $99,060 | $21,360 | $77,700 |
| 2024 | $13,913 | $103,500 | $21,360 | $82,140 |
| 2023 | $13,457 | $97,080 | $21,360 | $75,720 |
| 2022 | $12,627 | $80,340 | $21,360 | $58,980 |
| 2021 | $13,311 | $88,140 | $21,360 | $66,780 |
| 2019 | $12,076 | $68,520 | $21,360 | $47,160 |
| 2018 | $11,256 | $55,219 | $17,838 | $37,381 |
| 2017 | $10,445 | $52,708 | $17,786 | $34,922 |
| 2016 | $10,227 | $52,708 | $16,134 | $36,574 |
| 2015 | $5,778 | $50,544 | $22,489 | $28,055 |
| 2014 | $5,778 | $48,105 | $21,404 | $26,701 |
Source: Public Records
Map
Nearby Homes
- 2141 E 65th St
- 2129 E 65th St
- 2121 E 65th St
- 2147 E 65th St
- 2130 E 66th St
- 2130 E 66th St Unit Building
- 2136 E 66th St
- 2119 E 65th St
- 2126 E 66th St
- 2140 E 66th St
- 2117 E 65th St
- 2122 E 66th St
- 2122 E 66th St Unit 2
- 2146 E 66th St
- 2120 E 66th St
- 2153 E 65th St
- 2115 E 65th St
- 2134 E 65th St
- 2118 E 66th St
- 2128 E 65th St
Your Personal Tour Guide
Ask me questions while you tour the home.