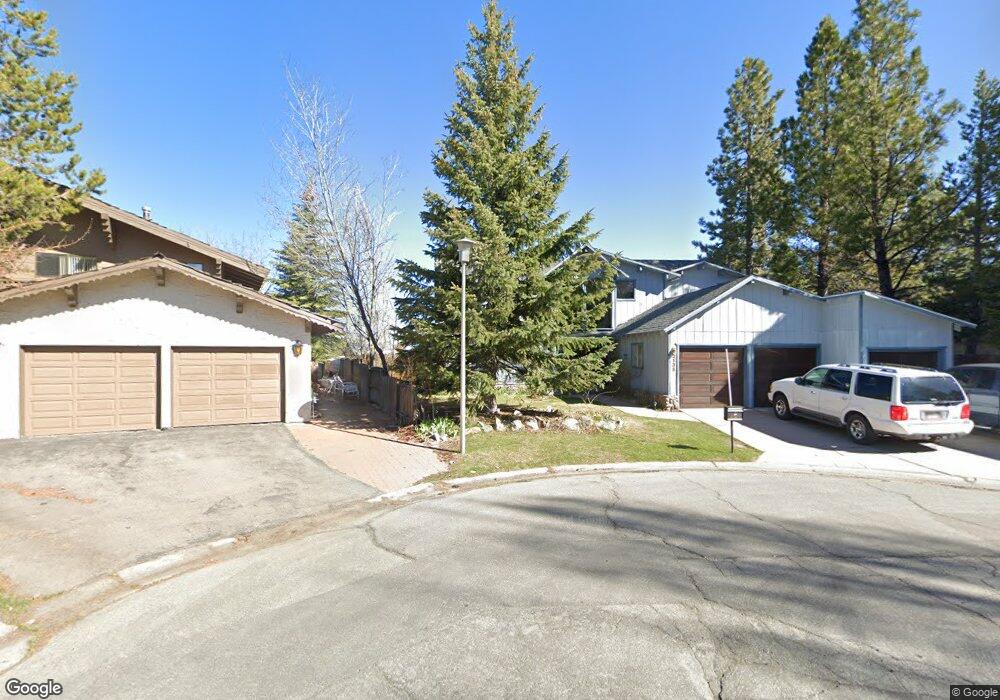
2135 Inverness Dr South Lake Tahoe, CA 96150
Estimated Value: $1,667,566 - $2,401,000
4
Beds
2
Baths
3,189
Sq Ft
$607/Sq Ft
Est. Value
About This Home
This home is located at 2135 Inverness Dr, South Lake Tahoe, CA 96150 and is currently estimated at $1,934,892, approximately $606 per square foot. 2135 Inverness Dr is a home located in El Dorado County with nearby schools including Tahoe Valley Elementary School, South Tahoe Middle School, and South Tahoe High School.
Ownership History
Date
Name
Owned For
Owner Type
Purchase Details
Closed on
Mar 8, 1999
Sold by
Rawlings Cindy Cuchna
Bought by
Rawlings Cindy Cuchna and Cindy Cuchna Rawlings Trust
Current Estimated Value
Purchase Details
Closed on
Jan 22, 1999
Sold by
Rawlings Gary M and Rawlings Cindy Cuchna
Bought by
Rawlings Cindy Cuchna
Purchase Details
Closed on
Nov 2, 1998
Sold by
Woodward Susan Raye
Bought by
Rawlings Gary M and Rawlings Cindy Cuchna
Home Financials for this Owner
Home Financials are based on the most recent Mortgage that was taken out on this home.
Original Mortgage
$227,150
Outstanding Balance
$49,669
Interest Rate
6.61%
Estimated Equity
$1,885,223
Purchase Details
Closed on
Oct 27, 1998
Sold by
Tew Brad
Bought by
Woodward Susan Raye
Home Financials for this Owner
Home Financials are based on the most recent Mortgage that was taken out on this home.
Original Mortgage
$227,150
Outstanding Balance
$49,669
Interest Rate
6.61%
Estimated Equity
$1,885,223
Purchase Details
Closed on
Apr 12, 1997
Sold by
Pipkin Kengla Cris Creola
Bought by
Woodward Susan Raye
Home Financials for this Owner
Home Financials are based on the most recent Mortgage that was taken out on this home.
Original Mortgage
$300,000
Interest Rate
7.66%
Create a Home Valuation Report for This Property
The Home Valuation Report is an in-depth analysis detailing your home's value as well as a comparison with similar homes in the area
Home Values in the Area
Average Home Value in this Area
Purchase History
| Date | Buyer | Sale Price | Title Company |
|---|---|---|---|
| Rawlings Cindy Cuchna | -- | -- | |
| Rawlings Cindy Cuchna | -- | -- | |
| Rawlings Gary M | $700,000 | Inter County Title Co | |
| Woodward Susan Raye | -- | Inter County Title Co | |
| Woodward Susan Raye | $401,000 | Fidelity National Title Co |
Source: Public Records
Mortgage History
| Date | Status | Borrower | Loan Amount |
|---|---|---|---|
| Open | Rawlings Gary M | $227,150 | |
| Previous Owner | Woodward Susan Raye | $300,000 |
Source: Public Records
Tax History Compared to Growth
Tax History
| Year | Tax Paid | Tax Assessment Tax Assessment Total Assessment is a certain percentage of the fair market value that is determined by local assessors to be the total taxable value of land and additions on the property. | Land | Improvement |
|---|---|---|---|---|
| 2025 | $6,863 | $659,198 | $274,335 | $384,863 |
| 2024 | $6,863 | $646,273 | $268,956 | $377,317 |
| 2023 | $6,742 | $633,602 | $263,683 | $369,919 |
| 2022 | $6,674 | $621,179 | $258,513 | $362,666 |
| 2021 | $6,569 | $609,000 | $253,445 | $355,555 |
| 2020 | $6,473 | $602,757 | $250,847 | $351,910 |
| 2019 | $6,440 | $590,939 | $245,929 | $345,010 |
| 2018 | $6,295 | $579,353 | $241,107 | $338,246 |
| 2017 | $6,194 | $567,994 | $236,380 | $331,614 |
| 2016 | $6,067 | $556,858 | $231,746 | $325,112 |
| 2015 | $5,755 | $548,496 | $228,266 | $320,230 |
| 2014 | $5,755 | $537,754 | $223,796 | $313,958 |
Source: Public Records
Map
Nearby Homes
- 569 Lucerne Way
- 2185 Morro Dr
- 555 Tahoe Keys Blvd Unit 13
- 2081 Venice Dr Unit 285
- 2081 Venice Dr Unit 280
- 497 Tahoe Keys Blvd Unit 20
- 276 Beach Dr
- 552 Christie Dr Unit 307
- 489 Tahoe Keys Blvd Unit 68
- 489 Tahoe Keys Blvd Unit 47
- 489 Tahoe Keys Blvd Unit 55
- 489 Tahoe Keys Blvd Unit 56
- 2030 Aloha Dr
- 2031 Venice Dr Unit 322
- 439 Ala Wai Blvd Unit 106
- 439 Ala Wai Blvd Unit 111
- 439 Ala Wai Blvd Unit 140
- 477 Ala Wai Blvd Unit 91
- 1938 Marconi Way
- 2191 Butler Ave
- 2141 Inverness Dr
- 2131 Inverness Dr
- 2145 Inverness Dr
- 2128 Inverness Dr
- 2134 Inverness Dr
- 2149 Inverness Dr
- 2130 Inverness Dr
- 2154 Catalina Dr
- 2138 Inverness Dr
- 2144 Inverness Dr
- 2155 Inverness Dr
- 2160 Catalina Dr
- 2148 Inverness Dr
- 419 Christie Dr
- 421 Christie Dr
- 2153 Catalina Dr
- 411 Christie Dr
- 409 Christie Dr
- 407 Christie Dr
- 2159 Inverness Dr