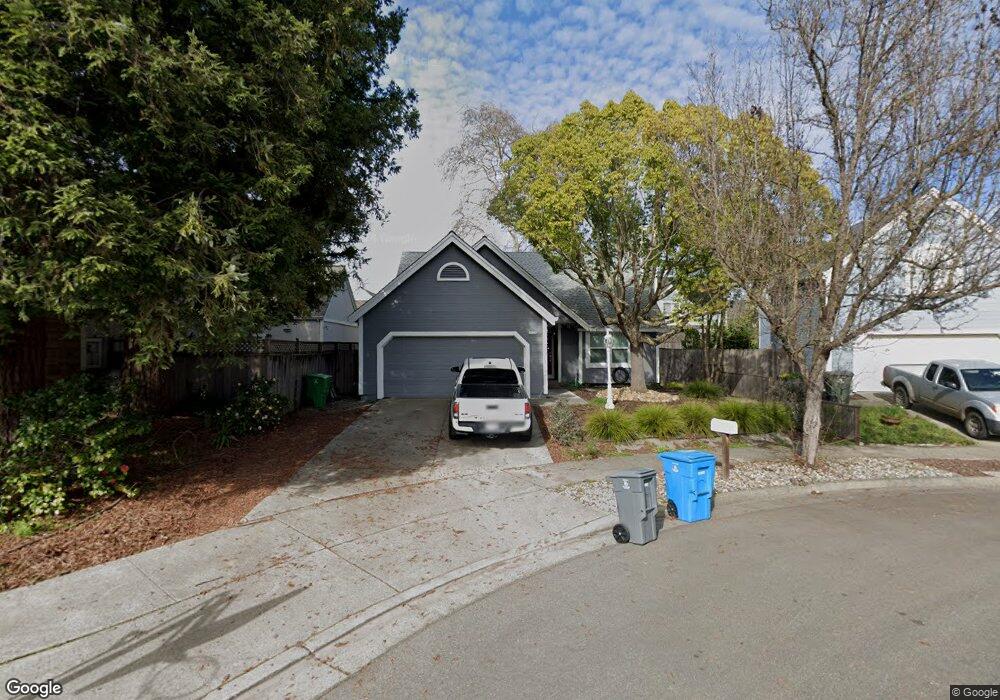
2135 Pebblewood Ct Santa Rosa, CA 95403
Northwest Santa Rosa NeighborhoodEstimated Value: $557,964 - $662,000
3
Beds
2
Baths
1,340
Sq Ft
$463/Sq Ft
Est. Value
About This Home
This home is located at 2135 Pebblewood Ct, Santa Rosa, CA 95403 and is currently estimated at $620,741, approximately $463 per square foot. 2135 Pebblewood Ct is a home located in Sonoma County with nearby schools including James Monroe Elementary School, Hilliard Comstock Middle School, and Piner High School.
Ownership History
Date
Name
Owned For
Owner Type
Purchase Details
Closed on
Dec 23, 2021
Sold by
Schwartz Kerrie A
Bought by
Kerrie A Schwartz Trust
Current Estimated Value
Purchase Details
Closed on
Aug 4, 2016
Sold by
Saxe Elliott
Bought by
Saxe Elliott
Home Financials for this Owner
Home Financials are based on the most recent Mortgage that was taken out on this home.
Original Mortgage
$195,500
Interest Rate
3.56%
Mortgage Type
New Conventional
Purchase Details
Closed on
Nov 12, 1999
Bought by
Saxe Elliott
Purchase Details
Closed on
Sep 26, 1994
Sold by
Bauman Daniel G and Bauman Sandra L
Bought by
Matulich Paul M
Home Financials for this Owner
Home Financials are based on the most recent Mortgage that was taken out on this home.
Original Mortgage
$166,250
Interest Rate
6.25%
Create a Home Valuation Report for This Property
The Home Valuation Report is an in-depth analysis detailing your home's value as well as a comparison with similar homes in the area
Home Values in the Area
Average Home Value in this Area
Purchase History
| Date | Buyer | Sale Price | Title Company |
|---|---|---|---|
| Kerrie A Schwartz Trust | -- | None Listed On Document | |
| Saxe Elliott | -- | First American Title Company | |
| Saxe Elliott | $230,000 | -- | |
| Matulich Paul M | $175,000 | Old Republic Title Company |
Source: Public Records
Mortgage History
| Date | Status | Borrower | Loan Amount |
|---|---|---|---|
| Previous Owner | Saxe Elliott | $195,500 | |
| Previous Owner | Matulich Paul M | $166,250 |
Source: Public Records
Tax History Compared to Growth
Tax History
| Year | Tax Paid | Tax Assessment Tax Assessment Total Assessment is a certain percentage of the fair market value that is determined by local assessors to be the total taxable value of land and additions on the property. | Land | Improvement |
|---|---|---|---|---|
| 2025 | $4,006 | $353,490 | $115,263 | $238,227 |
| 2024 | $4,006 | $346,559 | $113,003 | $233,556 |
| 2023 | $4,006 | $339,765 | $110,788 | $228,977 |
| 2022 | $3,701 | $333,104 | $108,616 | $224,488 |
| 2021 | $3,656 | $326,574 | $106,487 | $220,087 |
| 2020 | $3,648 | $323,227 | $105,396 | $217,831 |
| 2019 | $3,630 | $316,890 | $103,330 | $213,560 |
| 2018 | $3,609 | $310,677 | $101,304 | $209,373 |
| 2017 | $3,545 | $304,586 | $99,318 | $205,268 |
| 2016 | $3,516 | $298,615 | $97,371 | $201,244 |
| 2015 | $3,411 | $294,131 | $95,909 | $198,222 |
| 2014 | $3,203 | $288,371 | $94,031 | $194,340 |
Source: Public Records
Map
Nearby Homes
- 1626 Woodhue Ave
- 1520 Cabernet Cir
- 2311 Guerneville Rd
- 1516 Wadsworth Ct
- 2318 S Hampton Cir
- 1169 Putney Dr
- 1552 Moonview Ct
- 2024 Elson Way
- 1905 Belair Way
- 2423 Guerneville Rd
- 1715 Ridley Ave
- 1380 Velma Ave
- 1721 Jennings Ave
- 2291 Truckee Dr
- 1532 Pinebrook Place
- 2320 Masterson Ct
- 1507 Pinebrook Place
- 141 Stratford Way
- 66 Somerset Dr
- 1605 Charlene Place
- 1606 Gamay St
- 2133 Pebblewood Ct
- 1604 Woodhue Ave
- 1606 Woodhue Ave
- 1610 Gamay St
- 2131 Pebblewood Ct
- 1608 Woodhue Ave
- 1610 Woodhue Ave
- 2130 Pebblewood Ct
- 2136 Pebblewood Ct
- 1609 Gamay St
- 2138 Pebblewood Ct
- 2134 Pebblewood Ct
- 1605 Gamay St
- 1611 Gamay St
- 1612 Woodhue Ave
- 2132 Pebblewood Ct
- 1603 Gamay St
- 1613 Gamay St