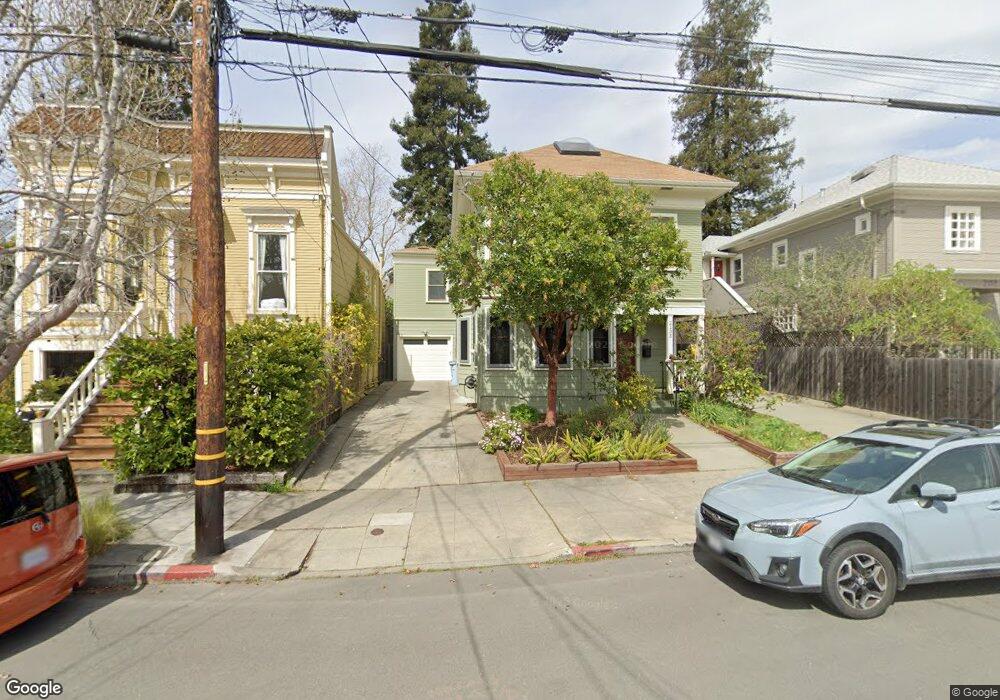
2135 Prince St Berkeley, CA 94705
South Berkeley NeighborhoodEstimated Value: $1,814,000 - $2,719,000
3
Beds
3
Baths
2,502
Sq Ft
$916/Sq Ft
Est. Value
About This Home
This home is located at 2135 Prince St, Berkeley, CA 94705 and is currently estimated at $2,290,870, approximately $915 per square foot. 2135 Prince St is a home located in Alameda County with nearby schools including Malcolm X Elementary School, Emerson Elementary School, and John Muir Elementary School.
Ownership History
Date
Name
Owned For
Owner Type
Purchase Details
Closed on
Oct 8, 2013
Sold by
Baer Properties Llc
Bought by
Mochizuki Swartz William Forman and Mochizuki Swartz Mieko
Current Estimated Value
Purchase Details
Closed on
Sep 4, 2013
Sold by
Baejrend David J and Vanderburg Karen
Bought by
Baer Properties Llc
Purchase Details
Closed on
Mar 6, 2013
Sold by
Weil Amanda Eliza
Bought by
Baehrend David J and Vanderburg Karen
Purchase Details
Closed on
Jul 6, 2012
Sold by
Sgt Investments Llc
Bought by
Weil Amanda Eliza
Purchase Details
Closed on
Aug 26, 2011
Sold by
Altschuler Hanan
Bought by
Sgt Investments Llc and Sgt Two Llc
Purchase Details
Closed on
May 1, 2002
Sold by
Altschuler Hanan
Bought by
Altschuler Hanan
Create a Home Valuation Report for This Property
The Home Valuation Report is an in-depth analysis detailing your home's value as well as a comparison with similar homes in the area
Home Values in the Area
Average Home Value in this Area
Purchase History
| Date | Buyer | Sale Price | Title Company |
|---|---|---|---|
| Mochizuki Swartz William Forman | $1,351,000 | Old Republic Title Company | |
| Baer Properties Llc | -- | Old Republic Title Company | |
| Baehrend David J | $600,000 | Old Republic Title Company | |
| Weil Amanda Eliza | $489,000 | Old Republic Title Company | |
| Sgt Investments Llc | $360,100 | None Available | |
| Altschuler Hanan | -- | Commonwealth Land Title |
Source: Public Records
Tax History
| Year | Tax Paid | Tax Assessment Tax Assessment Total Assessment is a certain percentage of the fair market value that is determined by local assessors to be the total taxable value of land and additions on the property. | Land | Improvement |
|---|---|---|---|---|
| 2025 | $24,813 | $1,649,068 | $496,820 | $1,159,248 |
| 2024 | $24,813 | $1,616,604 | $487,081 | $1,136,523 |
| 2023 | $24,251 | $1,591,774 | $477,532 | $1,114,242 |
| 2022 | $23,779 | $1,553,566 | $468,170 | $1,092,396 |
| 2021 | $23,855 | $1,522,980 | $458,994 | $1,070,986 |
| 2020 | $22,647 | $1,514,294 | $454,288 | $1,060,006 |
| 2019 | $21,831 | $1,484,613 | $445,384 | $1,039,229 |
| 2018 | $21,469 | $1,455,513 | $436,654 | $1,018,859 |
| 2017 | $20,755 | $1,426,980 | $428,094 | $998,886 |
| 2016 | $20,136 | $1,399,000 | $419,700 | $979,300 |
| 2015 | $19,866 | $1,377,992 | $413,397 | $964,595 |
| 2014 | $19,700 | $1,351,000 | $405,300 | $945,700 |
Source: Public Records
Map
Nearby Homes
- 2110 Ashby Ave
- 2124 Prince St
- 2057 Emerson St
- 2923 Wheeler St
- 3046 Deakin St
- 629 66th St
- 6555 Shattuck Ave
- 2243 Ashby Ave
- 6445 Irwin Ct
- 556 Alcatraz Ave
- 667 & 667A Alcatraz Ave
- 667 Alcatraz Ave
- 6320 Shattuck Ave
- 6300 Shattuck Ave Unit 1
- 2917 Telegraph Ave
- 2935 Florence St
- 2926 Ellis St
- 6446 Colby St
- 2319 Ward St
- 3233 Ellis St
Your Personal Tour Guide
Ask me questions while you tour the home.