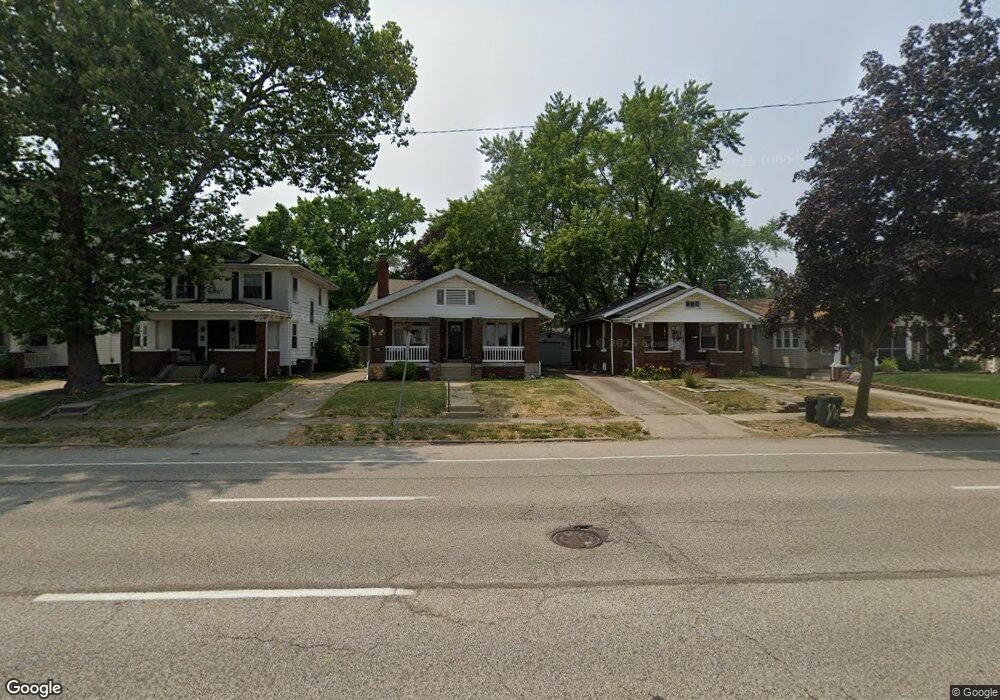
2135 S 6th St Springfield, IL 62703
Iles Park NeighborhoodEstimated Value: $94,000 - $132,000
2
Beds
2
Baths
1,250
Sq Ft
$89/Sq Ft
Est. Value
About This Home
This home is located at 2135 S 6th St, Springfield, IL 62703 and is currently estimated at $111,168, approximately $88 per square foot. 2135 S 6th St is a home located in Sangamon County with nearby schools including Harvard Park Elementary School, Jefferson Middle School, and Springfield Southeast High School.
Ownership History
Date
Name
Owned For
Owner Type
Purchase Details
Closed on
Apr 30, 2021
Sold by
Red River North Llc-River Nore Propertie
Bought by
Rademacher Andrew S
Current Estimated Value
Home Financials for this Owner
Home Financials are based on the most recent Mortgage that was taken out on this home.
Original Mortgage
$61,600
Outstanding Balance
$45,883
Interest Rate
2.25%
Mortgage Type
New Conventional
Estimated Equity
$65,285
Purchase Details
Closed on
Mar 11, 2020
Sold by
Stacey L Rademacher Declaration Of Trust
Bought by
Red River North Llc-River Nore Properties
Purchase Details
Closed on
Jun 28, 2018
Sold by
Pnc Bank National Association
Bought by
Declaratio Stacey L Rademacher
Purchase Details
Closed on
Aug 11, 2017
Sold by
Sheriff Of Sangamon County
Bought by
Pnc Bank National Association
Purchase Details
Closed on
Dec 12, 2013
Purchase Details
Closed on
Apr 23, 2009
Purchase Details
Closed on
Aug 26, 1998
Purchase Details
Closed on
Jul 14, 1995
Create a Home Valuation Report for This Property
The Home Valuation Report is an in-depth analysis detailing your home's value as well as a comparison with similar homes in the area
Home Values in the Area
Average Home Value in this Area
Purchase History
| Date | Buyer | Sale Price | Title Company |
|---|---|---|---|
| Rademacher Andrew S | $77,000 | Sheehan & Sheehan Lawyers | |
| Red River North Llc-River Nore Properties | -- | -- | |
| Declaratio Stacey L Rademacher | $46,100 | -- | |
| Pnc Bank National Association | $51,100 | Heavner Beyers & Mihlar Llc | |
| -- | -- | -- | |
| -- | $74,900 | -- | |
| -- | $64,000 | -- | |
| -- | $58,900 | -- |
Source: Public Records
Mortgage History
| Date | Status | Borrower | Loan Amount |
|---|---|---|---|
| Open | Rademacher Andrew S | $61,600 |
Source: Public Records
Tax History
| Year | Tax Paid | Tax Assessment Tax Assessment Total Assessment is a certain percentage of the fair market value that is determined by local assessors to be the total taxable value of land and additions on the property. | Land | Improvement |
|---|---|---|---|---|
| 2024 | $2,781 | $33,113 | $4,366 | $28,747 |
| 2023 | $2,674 | $30,246 | $3,988 | $26,258 |
| 2022 | $2,571 | $28,691 | $3,783 | $24,908 |
| 2021 | $2,486 | $27,616 | $3,641 | $23,975 |
| 2020 | $890 | $10,104 | $3,646 | $6,458 |
| 2019 | $869 | $10,019 | $3,633 | $6,386 |
| 2018 | $2,374 | $28,101 | $3,615 | $24,486 |
| 2017 | $1,822 | $27,737 | $3,568 | $24,169 |
| 2016 | $1,779 | $27,333 | $3,516 | $23,817 |
| 2015 | $1,756 | $27,006 | $3,474 | $23,532 |
| 2014 | $1,625 | $26,832 | $3,452 | $23,380 |
| 2013 | $1,589 | $25,607 | $3,452 | $22,155 |
Source: Public Records
Map
Nearby Homes
- 2349 S 5th St
- 2324 S 8th St
- 1933 S 1st St
- 2339 S 10th St
- 2001 S Spring St
- 2205 S 11th St
- 725 E Spruce St
- 1942 S 11th St
- 1728 S Spring St
- 2233 S 12th St
- 1708 S Spring St
- 2517 S 10th St
- 2516 S 10th St
- 1912 S Whittier Ave
- 709 Bryn Mawr Blvd Unit 1
- 1124 E Laurel St
- 1430 S 8th St
- 2160 S 14th St
- 2621 S 4th St Unit 1
- 1004 Bryn Mawr Blvd
Your Personal Tour Guide
Ask me questions while you tour the home.