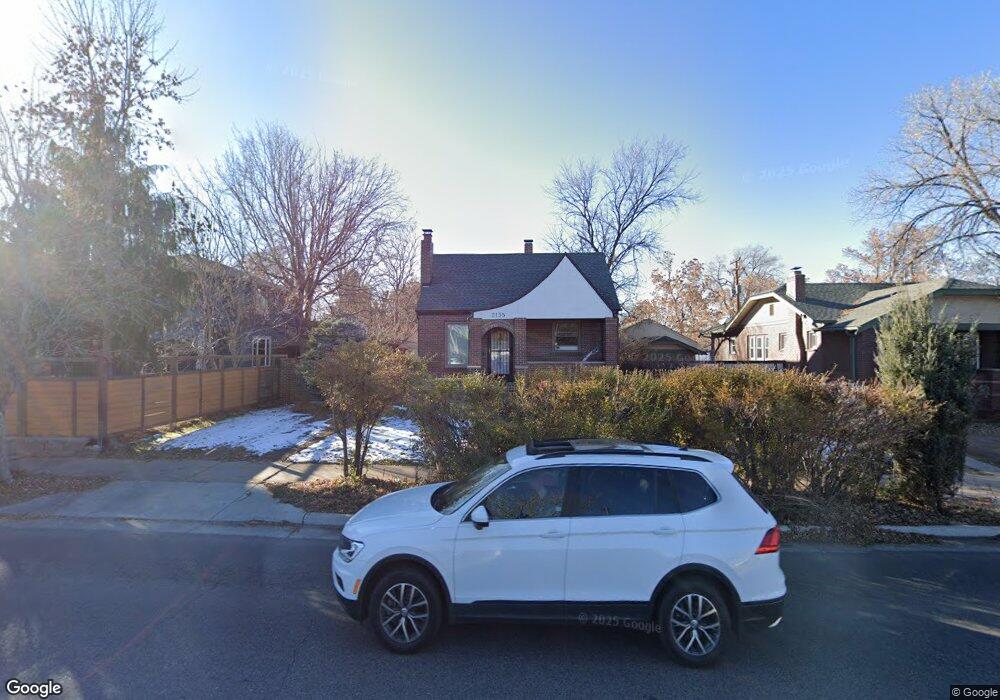
2135 S Downing St Denver, CO 80210
Rosedale NeighborhoodEstimated Value: $638,000 - $780,000
2
Beds
4
Baths
1,471
Sq Ft
$482/Sq Ft
Est. Value
About This Home
This home is located at 2135 S Downing St, Denver, CO 80210 and is currently estimated at $709,658, approximately $482 per square foot. 2135 S Downing St is a home located in Denver County with nearby schools including Asbury Elementary School, Grant Beacon Middle School, and South High School.
Ownership History
Date
Name
Owned For
Owner Type
Purchase Details
Closed on
Apr 27, 2020
Sold by
Wiley Christopher A
Bought by
Wiley Christopher A and Wiley Erin
Current Estimated Value
Home Financials for this Owner
Home Financials are based on the most recent Mortgage that was taken out on this home.
Original Mortgage
$233,000
Outstanding Balance
$206,470
Interest Rate
3.3%
Mortgage Type
New Conventional
Estimated Equity
$503,188
Purchase Details
Closed on
Apr 14, 2008
Sold by
Larm Ronald D and Larm Sally J
Bought by
Wiley Christopher A
Home Financials for this Owner
Home Financials are based on the most recent Mortgage that was taken out on this home.
Original Mortgage
$293,888
Interest Rate
6.19%
Mortgage Type
FHA
Purchase Details
Closed on
Jan 21, 2007
Sold by
Larm Ronald D
Bought by
Larm Ronald D and Larm Sally J
Purchase Details
Closed on
Jan 16, 1998
Sold by
Roxanne Perez and Roxanne Bernard
Bought by
Larm Ronald D
Home Financials for this Owner
Home Financials are based on the most recent Mortgage that was taken out on this home.
Original Mortgage
$141,550
Interest Rate
7.13%
Create a Home Valuation Report for This Property
The Home Valuation Report is an in-depth analysis detailing your home's value as well as a comparison with similar homes in the area
Home Values in the Area
Average Home Value in this Area
Purchase History
| Date | Buyer | Sale Price | Title Company |
|---|---|---|---|
| Wiley Christopher A | -- | Prestige Title | |
| Wiley Christopher A | $298,500 | Fahtco | |
| Larm Ronald D | -- | None Available | |
| Larm Ronald D | $149,000 | Land Title |
Source: Public Records
Mortgage History
| Date | Status | Borrower | Loan Amount |
|---|---|---|---|
| Open | Wiley Christopher A | $233,000 | |
| Closed | Wiley Christopher A | $293,888 | |
| Previous Owner | Larm Ronald D | $141,550 |
Source: Public Records
Tax History Compared to Growth
Tax History
| Year | Tax Paid | Tax Assessment Tax Assessment Total Assessment is a certain percentage of the fair market value that is determined by local assessors to be the total taxable value of land and additions on the property. | Land | Improvement |
|---|---|---|---|---|
| 2024 | $3,658 | $46,180 | $33,980 | $12,200 |
| 2023 | $3,578 | $46,180 | $33,980 | $12,200 |
| 2022 | $3,117 | $39,190 | $26,050 | $13,140 |
| 2021 | $3,117 | $40,310 | $26,800 | $13,510 |
| 2020 | $2,664 | $35,900 | $21,210 | $14,690 |
| 2019 | $2,589 | $35,900 | $21,210 | $14,690 |
| 2018 | $2,352 | $30,400 | $20,240 | $10,160 |
| 2017 | $2,345 | $30,400 | $20,240 | $10,160 |
| 2016 | $1,927 | $23,630 | $17,401 | $6,229 |
| 2015 | $1,846 | $23,630 | $17,401 | $6,229 |
| 2014 | $1,782 | $21,460 | $14,917 | $6,543 |
Source: Public Records
Map
Nearby Homes
- 2195 S Downing St
- 2117 S Lafayette St
- 2056 S Ogden St
- 2232 S Ogden St
- 2176 S Emerson St
- 2264 S Corona St
- 2250 S Ogden St
- 2033 S Ogden St
- 2000 S Ogden St
- 2121 S Humboldt St
- 2260 S Lafayette St
- 2035 S Humboldt St
- 2251 S Emerson St
- 2042 S Humboldt St
- 2175 S Clarkson St
- 1925 S Corona St
- 2168 S Franklin St
- 2140 S Washington St
- 2255 S Franklin St
- 2060 S Washington St
- 2127 S Downing St
- 2155 S Downing St
- 2161 S Downing St
- 2124 S Corona St
- 2140 S Corona St
- 2118 S Corona St
- 2150 S Corona St
- 2169 S Downing St
- 2110 S Corona St
- 2160 S Corona St
- 1100 E Evans Ave
- 2175 S Downing St
- 2164 S Corona St
- 2166 S Corona St
- 2183 S Downing St
- 2133 S Corona St
- 2127 S Corona St
- 2119 S Corona St
- 2151 S Corona St
- 2182 S Corona St